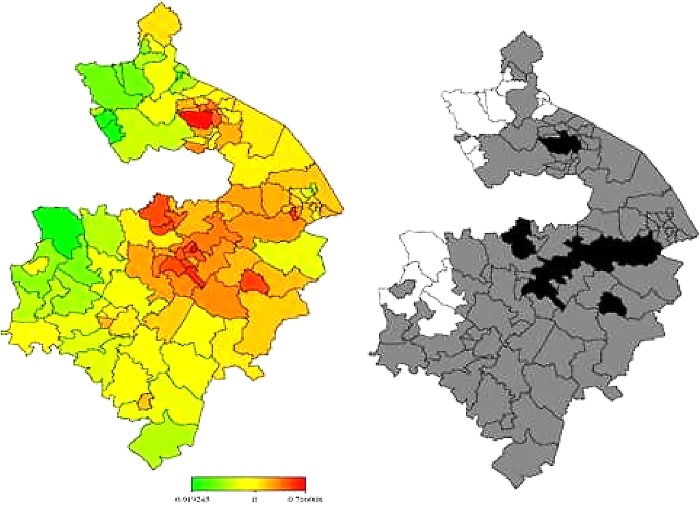
Figure 6.
Left: total residual spatial effects of mortality risk associated with heart failure at ward level in Warwickshire; shown are the posterior means of the full model (IMD 2010, Over 50 and the 4 indicators of air pollution). Right: corresponding posterior probabilities at 80% nominal level. Red coloured—high risk; Green coloured—low risk; Black coloured—significant positive spatial effect; White coloured—significant negative spatial effect; Grey coloured—no significant effect.

