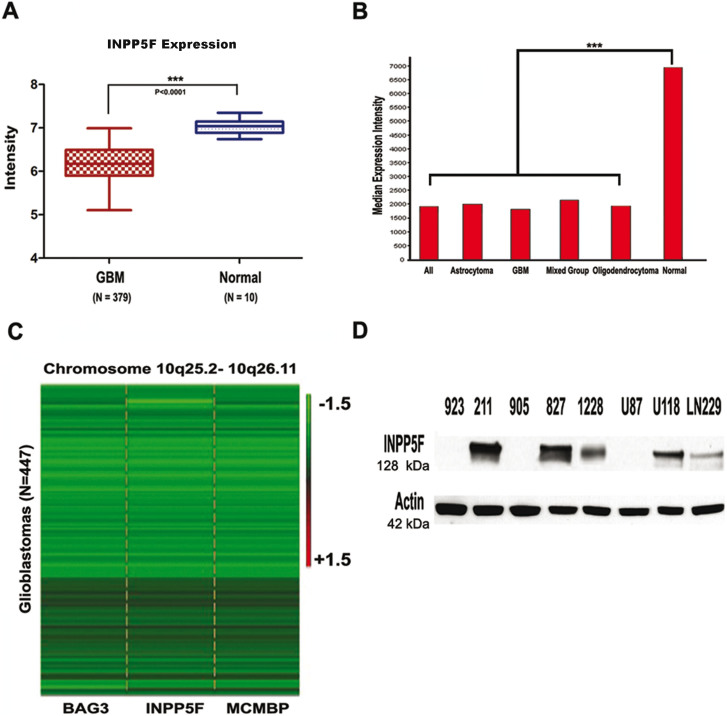
Figure 1. INPP5F gene locus is frequently deleted and the expression is deregulated in gliomas.
(A) The box and whisker plots show INPP5F expression in 379 glioblastomas (dark red) and in 10 non-tumor brain samples (blue) analyzed from TCGA dataset. The box indicates the 25% ~ 75% quartile and the bars indicate the upper and lower extreme values within the groups (***: p <0.0001). (B) Median expression intensity of INPP5F (probe 203607) in REMBRANDT dataset represents that INPP5F expression in all types of gliomas is decreased compare to non-tumor brain samples (***: p<0.0001). (C) Copy number heatmap of INPP5F and its neighboring genes from TCGA glioblastomas dataset. The green color in the map indicates deletion and black color represents normal copy numbers. (D) INPP5F is differently expressed in GSCs and established glioblastoma cell lines at the protein level.

