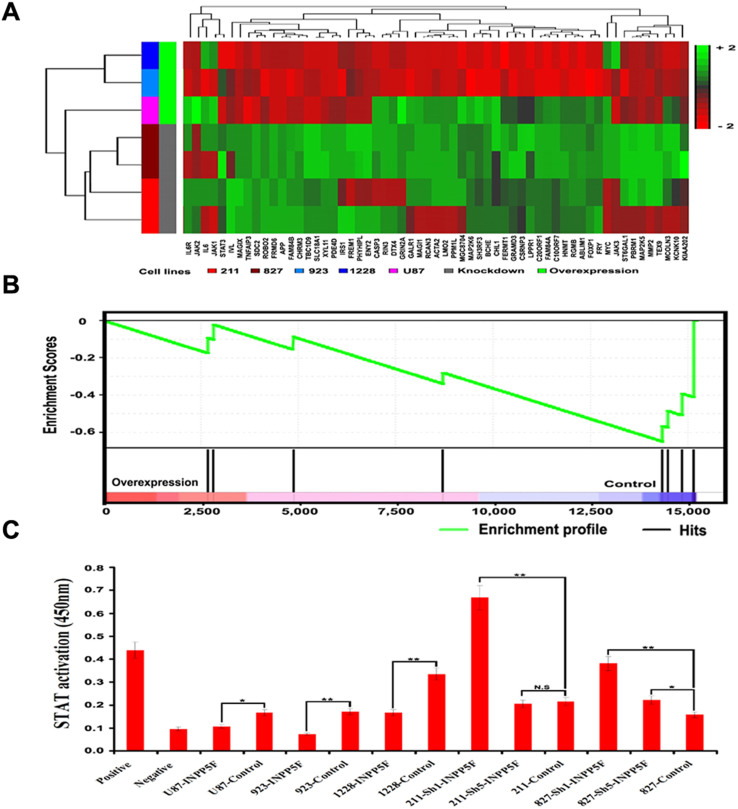
Figure 3. INPP5F regulates STAT3 pathway.
(A) Hierarchical clustering heatmap of 59 INPP5F signature genes. The signature genes were derived by contrasting experimental control to the corresponding glioblastoma cell lines with either INPP5F overexpression (GSC1228, GCS923, and U87) or knockdown (GSC211 and GSC827). Green color in heatmap indicates increased expression and red color indicates decreased expression in cells with INPP5F overexpression and knockdown, respectively. The vertical bars represent cell lines. (B) Gene set enrichment analysis of STAT3 signaling pathway in INPP5F overexpressing1228 GSCs, compared with control. The green curve represents running enrichment score profile and the lower panel refers to the gene hits in STAT3 signaling pathway along the rank in ordered expression datasets. The normalized enrichment score for this analysis is -1.97 and the p-value is 0.015. (C) STAT3 activity analysis assay. Nuclear fractions were used for detection of STAT3 activity and observed in wavelength of 450 mn. Data show that the STAT3 activation was inhibited by INPP5F overexpression but enhanced by INPP5F knockdown as pair comparison, (NS: no significant; * p<0.05; ** p<0.001; compared to control). Error bars represent standard deviation (S.D., experiment performed in triplicates).

