
Figure 1.
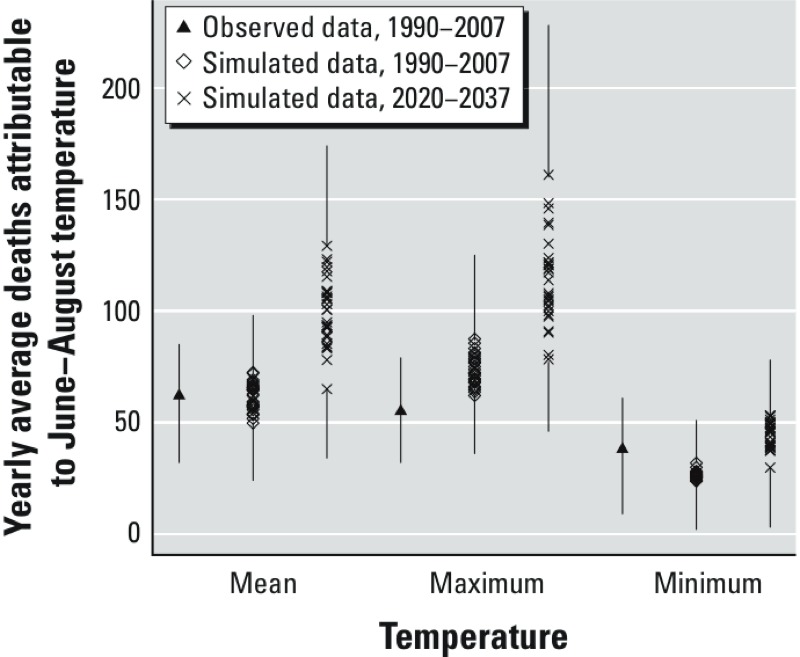
Estimated average annual deaths attributable to temperature (daily mean, daily maximum, or daily minimum) during June–August based on observed data for 1990–2007 and simulated data for 1990–2007 and 2020–2037. Simulated data are based on 32 simulations from RCMs and GCMs and corrected by the DT method. Deaths attributable to simulated temperatures were estimated with a set of RRs based on the observed historical data. The upper lines represent the ANs calculated with the set of RRs that generated the upper 95% CI bound of the ANs for the highest attributable number of deaths; the lower lines represent the ANs calculated with the set of RRs that generated the lower 95% CI bound of the ANs for the lowest attributable number of deaths. The three sets of RRs were also used to generate the attributable numbers for the observed data.