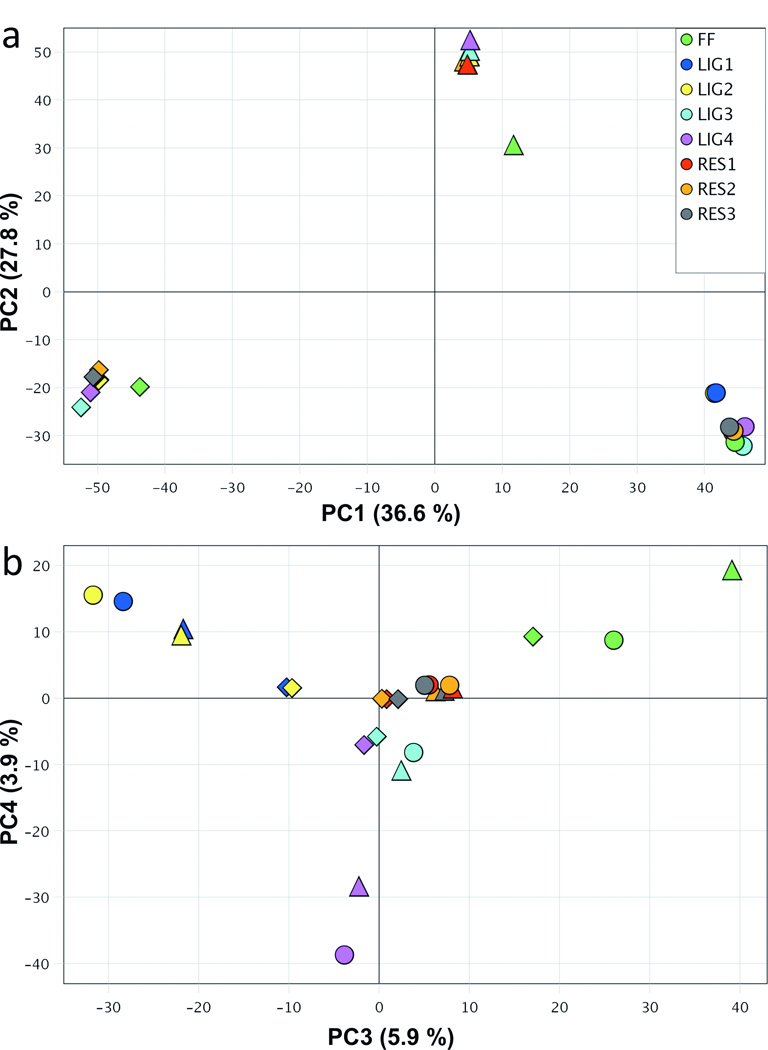
Figure 2. Principal component analysis (PCA) to identify the sources of variation in methylation β-values across the three patient samples and all conditions.
Patient samples are denoted by shape (A – circle, B – triangle and C – diamond). (a) Scatter plot of samples in the first and second principal components (PC1 and PC2), which account for 36.6% and 27.8% of the variation. (b) Scatter plot of PC3 and PC4, which explained 5.9% and 3.9% of the variation with separation by tissue storage type (FF vs. FFPE) as well as the ligation method (LIG vs. RES).

