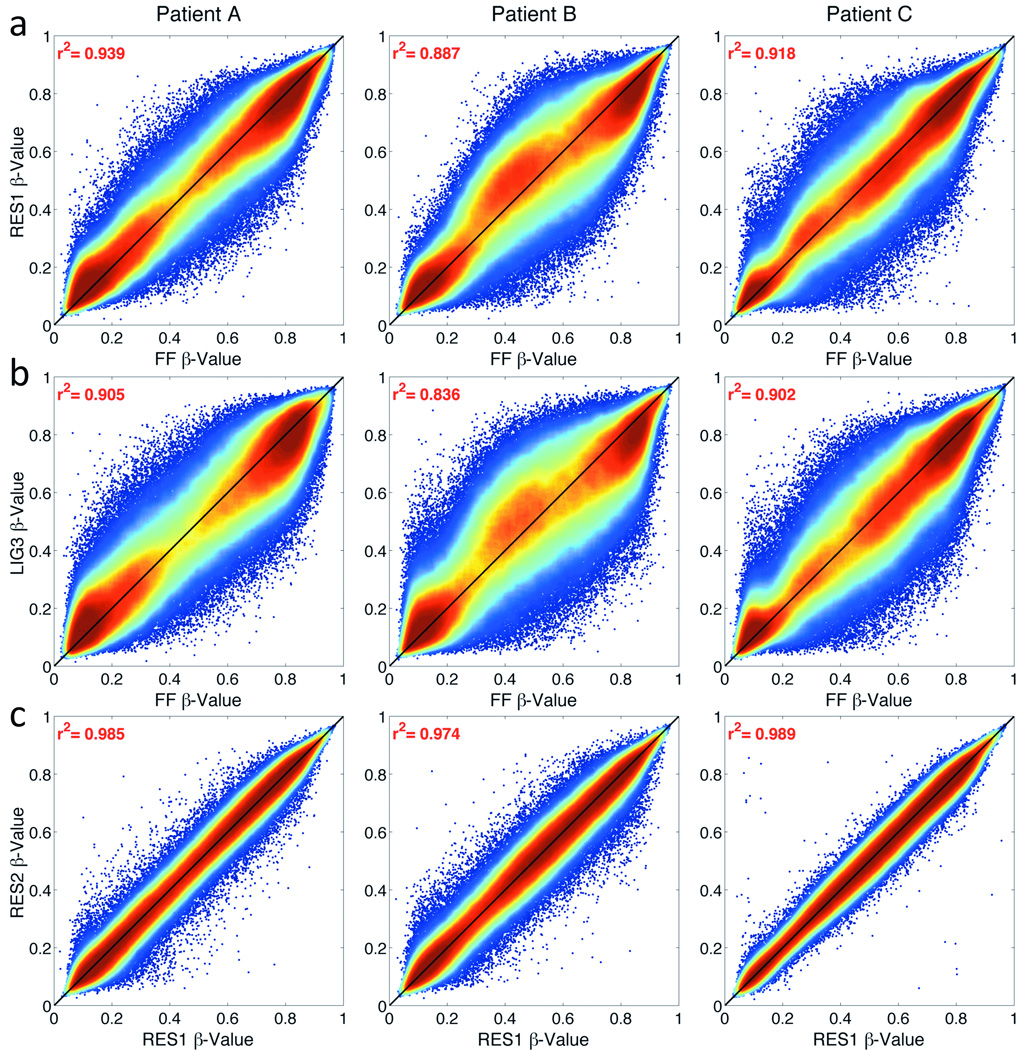
Figure 4. Representative density correlation plot between FF-FFPE pairs.
Correlation of DASEN normalized β-values for (a) Restore (RES1 vs. FF) and (b) REPLI-g Ligase (LIG3 vs. FF) for each patient sample. (c) Correlation between FFPE Restore-processed samples by input DNA amount (500ng RES1 vs. 250ng RES2).

