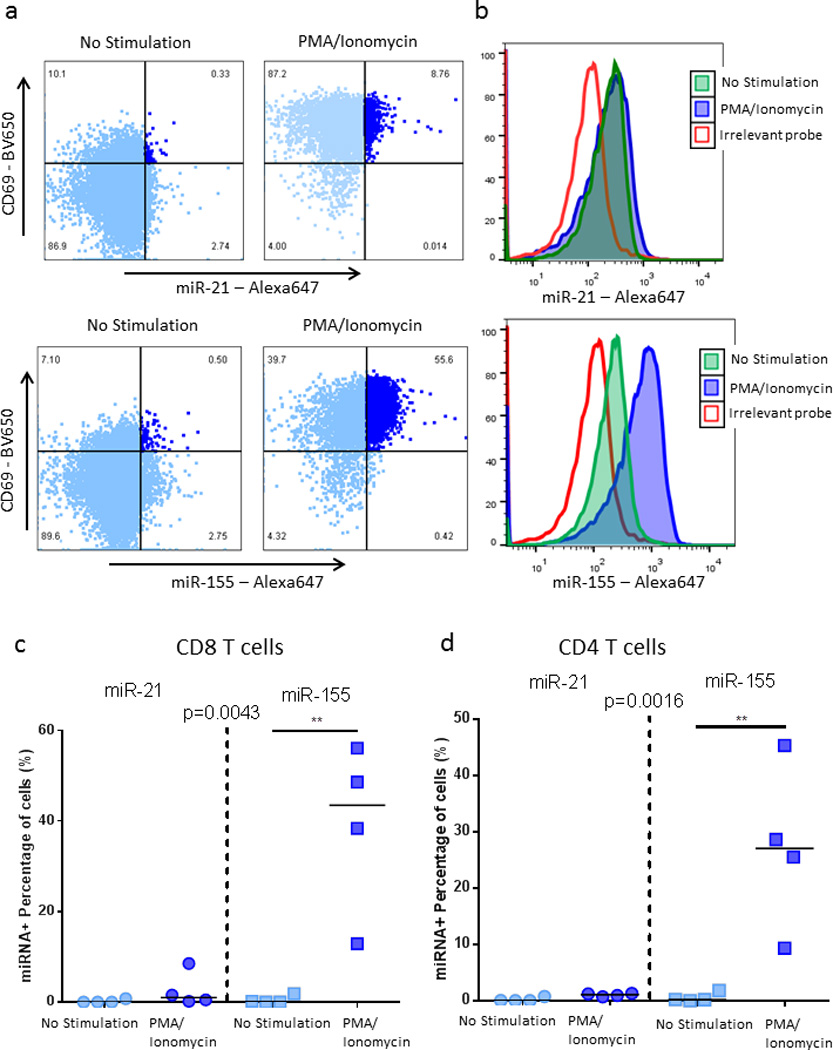
Figure 6. miRNA detection in CD4 and CD8 T cells with flow cytometry.

PBMCs from HIV-negative subjects were left unstimulated or were stimulated overnight with PMA/Ionomycin. (a, b) Representative example of miR-21 and miR-155 expression in CD8 T cells. (c, d)Collective data on four subjects for the detection of miR-21 and miR-155 in CD69+ activated CD8 and CD4 T cells. Statistical analysis used Friedman test with a Dunn’s post test comparison.
