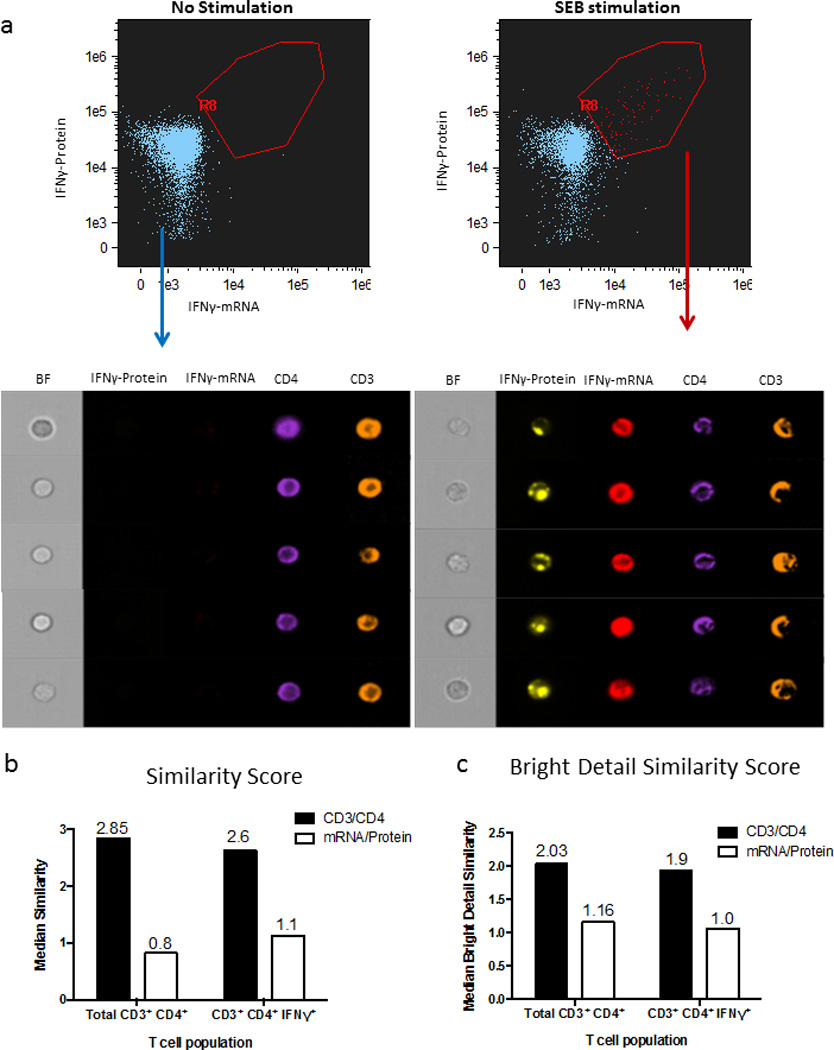
Figure 7. Combined detection of IFNγ protein and mRNA with ImageStream.

(a) PBMCs from an HIV-negative subject were left unstimulated or stimulated with SEB for 12 hours. At the end of this incubation time, a 45-minute capture assay was performed for detection of IFNγ-protein, followed by IFN-γmRNA staining with the flow-FISH assay. CD4 T cells were then acquired on an ImageStream instrument. Images illustrate expression of IFN-γ protein, IFN-γ mRNA, CD4 and CD3 in the lymphocyte gate in unstimulated cells (left panels) and in stimulated cells (right panels).(b–c) Co-localization analysis for CD3/CD4 in black and IFNg protein/mRNA in white using two different analytical tools (b) Similarity score (the log transformed Pearson’s correlation coefficient, measuring the spatial linear correlation between two total stains within a cell mask) and (c) Bright Detail Similarity score (the log transformed Pearson’s correlation coefficient, measuring the spatial linear correlation between the only the bright regions of two stains within a cell mask). We found a low correlation between secreted IFNg protein and internal mRNA using both measures (median score ~1). In comparison, surface stained CD3 and CD4 were well correlated (median score ~2).
