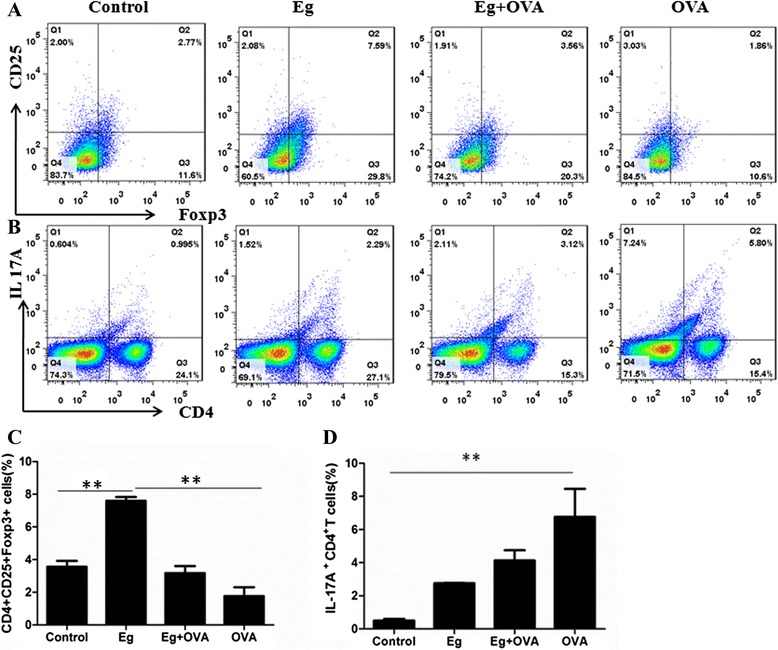
Figure 5.

Effects of E. granulosus infection on the proportion of Treg cells and Th17 cells in the spleen. Original dot plots from FACS analysis of CD4+CD25+Foxp3+ Treg cells (A) and IL-17A+ CD4+ T cells (B) isolated from spleens. The numbers in the dot plots indicate the percent of cells within each quadrant. C and D show the percentage of CD4+CD25+Foxp3+ Treg cells and IL-17A+ CD4+ T cells of the splenocytes. Data are mean ± SEM of five mice, in two separate experiments. *, p <0.05; **, p <0.01.
