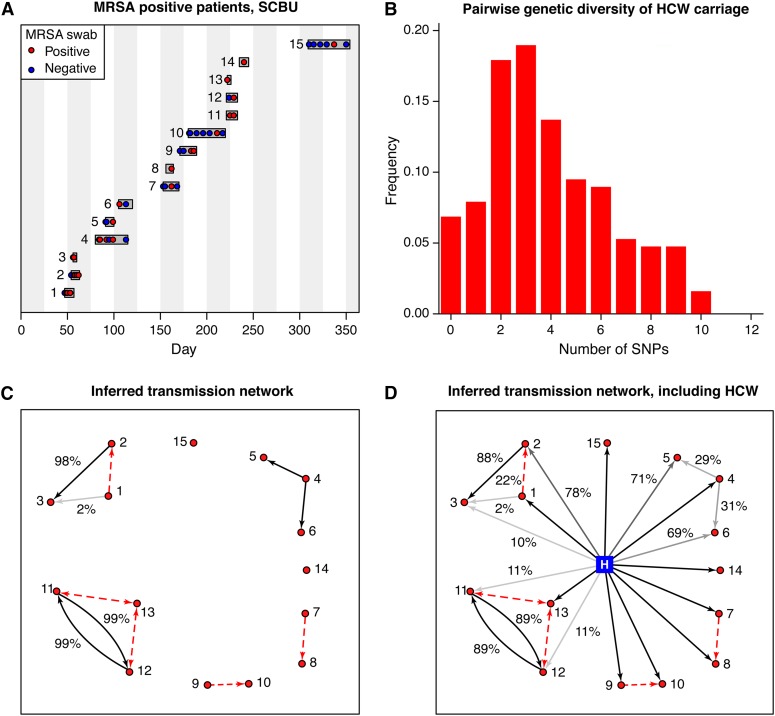
Figure 5.
Data and transmission route inference for the MRSA outbreak in the SCBU. (A) Patient episodes are shown as horizontal bars, with colored circles representing positive and negative swab results. (B) The observed pairwise genetic distances between the 20 sequenced isolates collected from the HCW. (C) Inferred transmission routes are shown, excluding the possibility of HCW–patient transmission. Red dashed lines indicate routes excluded at the 5% level. All temporally consistent transmission routes are shown. Posterior probability is 100% unless stated. (D) Inferred transmission routes, including the HCW as a potential source. The HCW is marked as a blue square.

