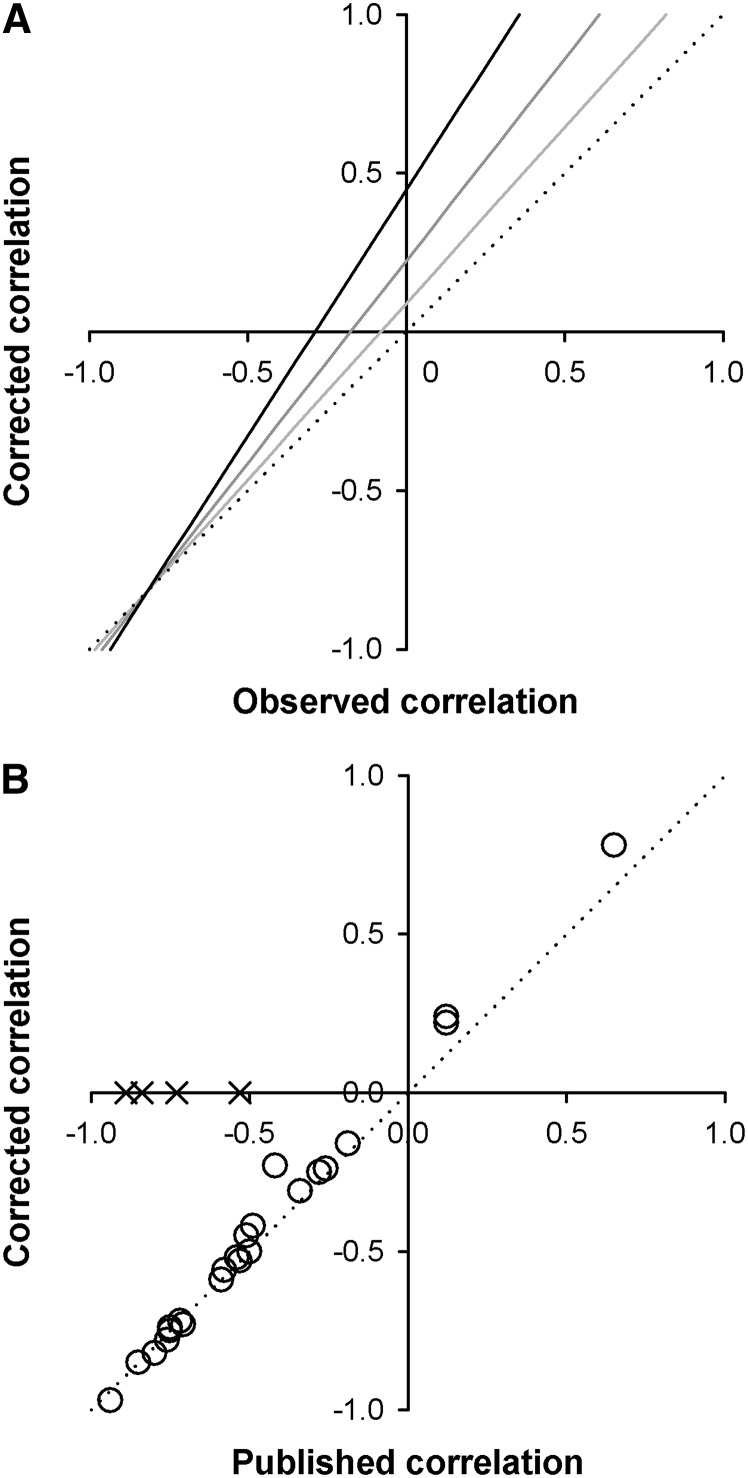
Figure 1.
The relationship between observed and corrected estimates of diminishing-returns epistasis. (A) Predicted relationship between (i.e., the observed correlation; Equation 2) and (the corrected correlation; Equation 5), showing that for moderately negative and positive correlations, the observed correlation is biased downward, whereas for very strongly negative correlations it is biased upward. For illustrative purposes, σ2(ai) = σ2(aj) = 1 and σ2(iij) = 0.5. Lines with light shading, lines with dark shading, and solid lines represent σ2(ei) = σ2(ej) = σ2(eij) = 0.1, 0.2, and 0.5, respectively. The dotted line designates the 1:1 relationship between observed and corrected estimates. (B) Published and corrected estimates of 25 correlations from 15 studies for which variance components were available (see Table S1 and Table S2). The line designates a 1:1 relationship between the published and corrected correlations. An additional four correlations (crosses) could not be corrected due to nonsignificant epistatic variance. Their placement on the x-axis shows their published values. Although there is overall evidence for diminishing-returns epistasis from this body of literature (correlations are still strongly negative on average, following correction), regression to the mean has led to downwardly biased estimates and four cases of published negative correlations based on nonsignificant epistatic variance.

