Figure 2.
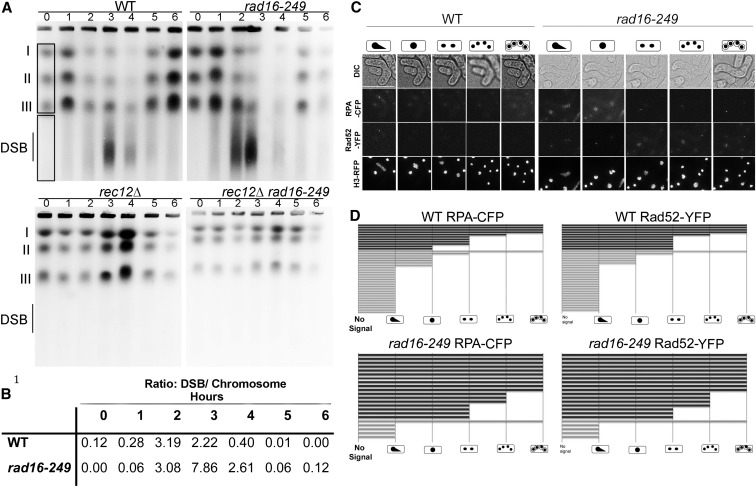
Meiotic DSBs in diploids. Data from representative experiment selected from three independent trials. (A) Representative image of three pulse field gel experiments of synchronous mat2-102 pat1-114 diploid meiosis indicating chromosomes I, II, III, and DSBs for 0, 1, 2, 3, 4, 5, and 6 hr. (B) Quantification of gel in A showing the ratio of DSBs/total chromosome signal for each time point once the local background has been subtracted. (C) Representative panels of live cell imaging for RPA-CFP and Rad52-YFP. Bar, 15 μm. (D) Quantification of RPA-CFP and Rad52-YFP focus persistence in meiotic cells. Each bar is a single cell. Bars with dark shading indicate cells in which there was an abnormal segregation event; bars with light shading represent apparently normal meiotic progression.

