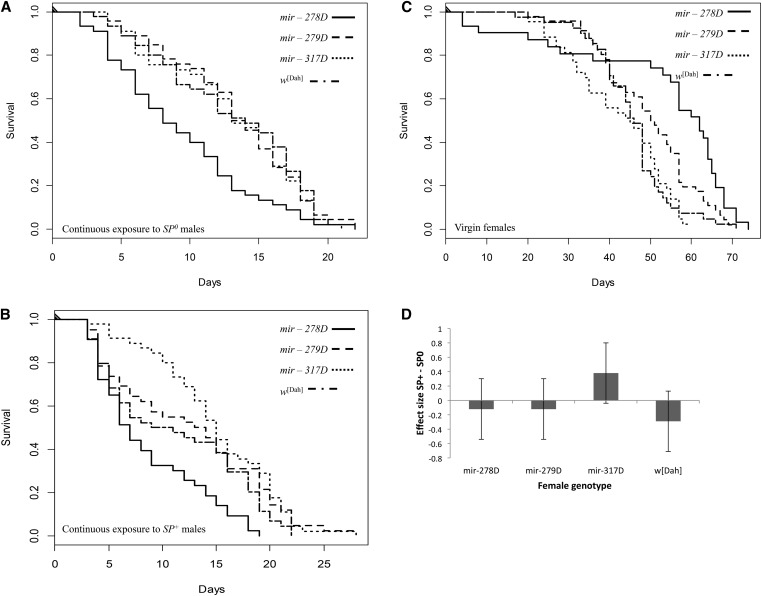
Figure 4.
Survival of all the females shown in Figure 3 redrawn to illustrate survival following exposure to either (A) SP0 or (B) SP+ males in comparison to the survival of (C) virgin females. (D) Mean survival effect sizes and 95% CI for the different female genotypes held continuously with SP+ vs. SP0 males.

