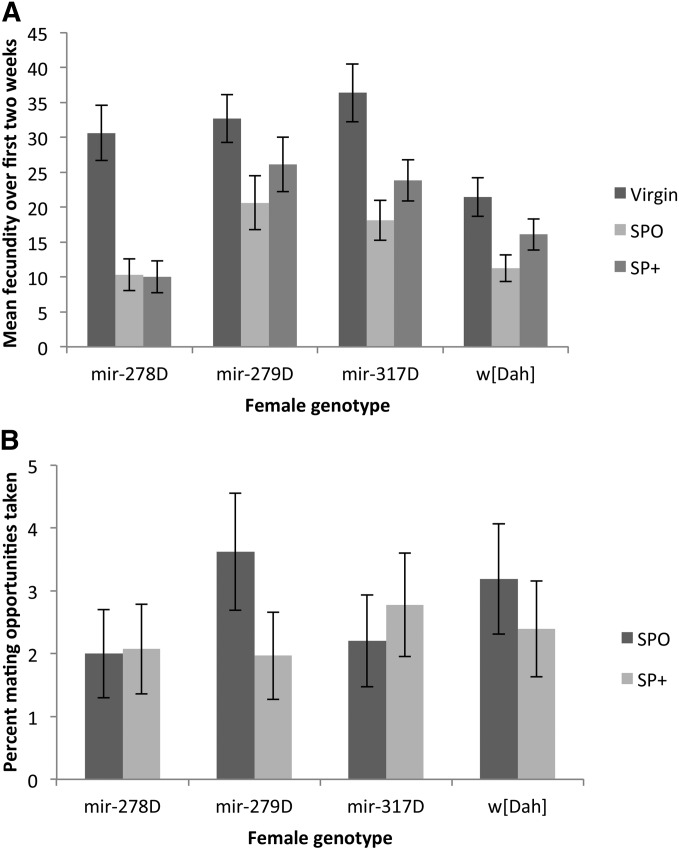
Figure 5.
(A) Mean (± SE) reproductive output of miRNA mutant females shown in Figure 3. The reproductive output of 21 randomly sampled females per treatment was recorded for a period of 6 hr every week over the first 2 weeks of the survival experiment. (B) The percentage of mating opportunities taken by the females in A when continuously held with males lacking SP (SP0, bars with dark shading) or control males (SP+, bars with light shading).

