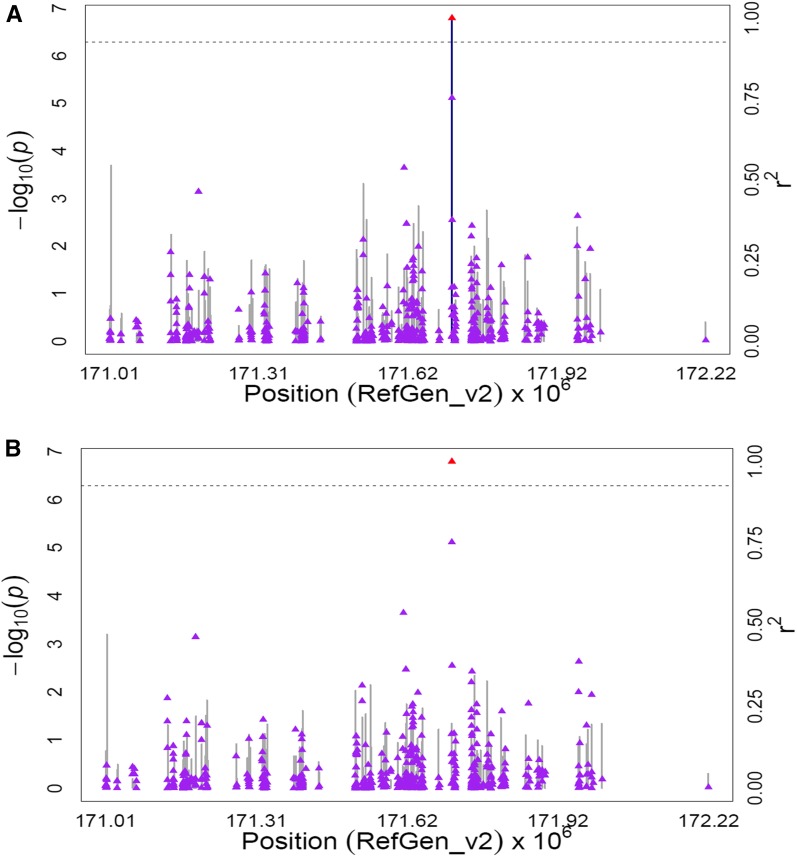
Figure 5.
GWAS for total β-xanthophylls content in maize grain. (A) Scatter plot of association results from a unified mixed model analysis of total β-xanthophylls and LD estimates (r2) across the surrounding chromosome region. Negative log10-transformed P-values (left y-axis) from a GWAS for total β-xanthophylls and r2 values (right y-axis) are plotted against physical position (B73 RefGen_v2) for a 1.2-Mb region on chromosome 8. The blue vertical lines are –log10 P-values for SNPs that are statistically significant for total β-xanthophylls at 5% FDR, while the gray vertical lines are –log10 P-values for SNPs that are nonsignificant at 5% FDR. Triangles are the r2 values of each SNP relative to the peak SNP (indicated in red) at 171,705,574 bp. The black horizontal dashed line indicates the –log10 P-value of the least statistically significant SNP at 5% FDR. (B) Scatter plot of association results from a conditional unified mixed model analysis of total β-xanthophyll and LD estimates (r2) across the 1.2-Mb chromosome region, as in A. The peak SNP from the unconditional GWAS (S8_171705574; 171,705,574 bp) was included as a covariate in the unified mixed model to control for the novel effect detected on chromosome 8.

