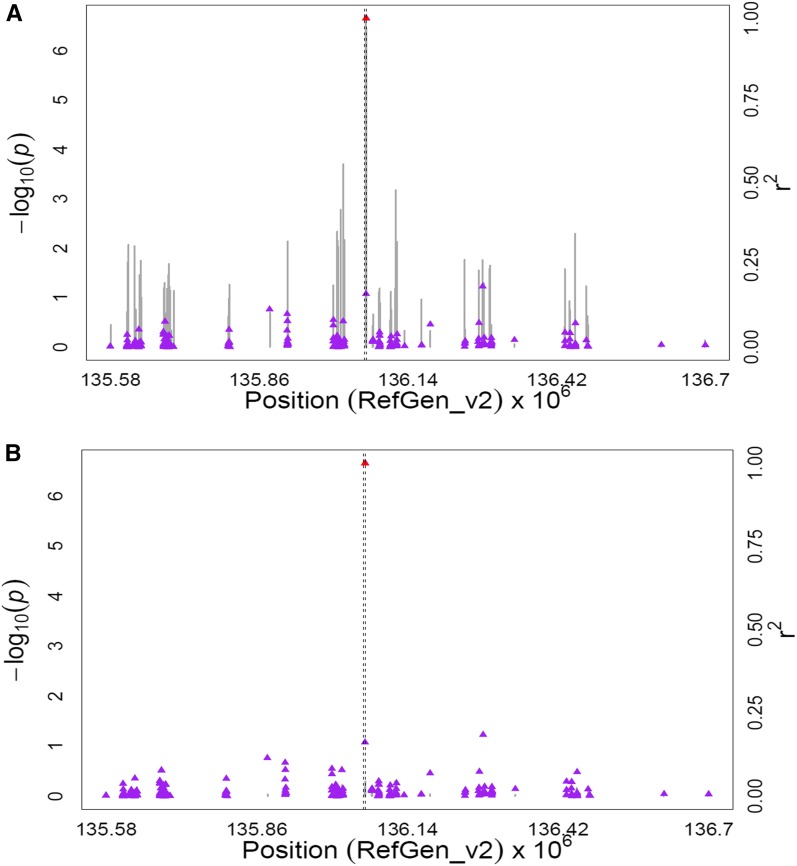
Figure 6.
GWAS for the ratio of β-carotene to β-cryptoxanthin plus zeaxanthin content in maize grain. (A) Scatter plot of association results from a unified mixed model analysis of the ratio of β-carotene to β-cryptoxanthin plus zeaxanthin and LD estimates (r2) across the crtRB1 chromosome region. Negative log10-transformed P-values (left y-axis) from a GWAS for the ratio of β-carotene to β-cryptoxanthin plus zeaxanthin and r2 values (right y-axis) are plotted against physical position (B73 RefGen_v2) for a 1.2-Mb region on chromosome 10 that encompasses crtRB1. The vertical lines are –log10 P-values for all tested SNPs in this region. Triangles are the r2 values of each SNP relative to the peak polymorphism (indicated in red) at 136,059,748 bp. The black vertical dashed lines indicate the start and stop positions of crtRB1 (GRMZM2G152135). (B) Scatter plot of association results from a conditional unified mixed model analysis of the ratio of β-carotene to β-cryptoxanthin plus zeaxanthin and LD estimates (r2) across the crtRB1 chromosome region, as in A. The peak polymorphism from the unconditional GWAS (crtRB1 InDel4; 136,059,748 bp) was included as a covariate in the unified mixed model to control for the crtRB1 effect.

