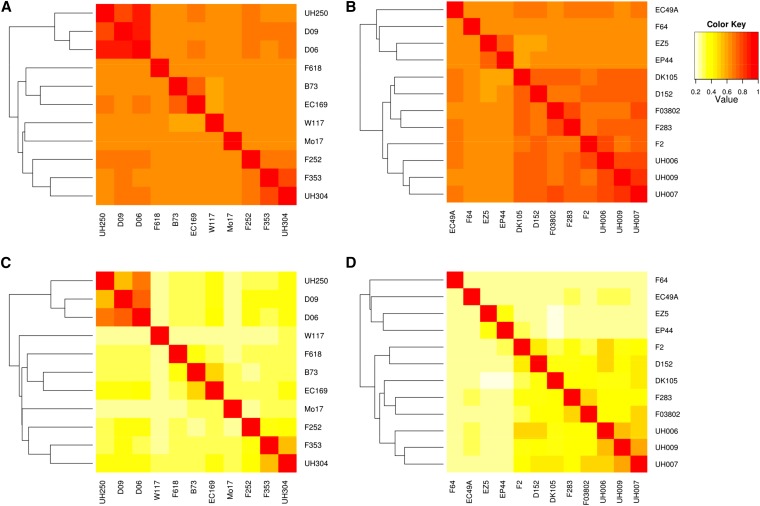
Figure 2.
Similarities between the dent (left) and the flint parental lines (right), computed based on direct marker genotyping (top) and on ancestral allele sharing (using clusthaplo and a 2-cM window size) (bottom). Yellow corresponds to a low similarity, red corresponds to a high similarity (color scale on the top-right corner). Lines were ordered according to their position in the dendogram (on the top and on the left of each graph) obtained by a hierarchical clustering based on similarities. (A) Similarities between the dent parental lines computed based on direct marker genotyping. (B) Similarities between the flint parental lines computed based on direct marker genotyping. (C) Similarities between the dent parental lines computed based on ancestral allele sharing (using clusthaplo and a 2-cM window size). (D) Similarities between the flint parental lines computed based on ancestral allele sharing (using clusthaplo and a 2-cM window size).

