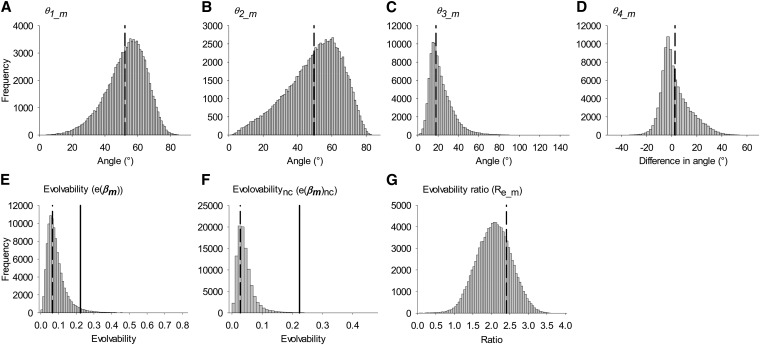
Figure 3.
The simulated distribution of estimates of θ and e(β) for males. (A) θ1_m; (B) θ2_m; (C) θ3_m; (D) θ4_m; (E) e(βm); (F) e(βm)nc; (G) Re_m. Values <0 cannot exist except for θ4_m. Dashed lines show the position of the “best estimate,” Solid lines show the position of the average evolvability over random selection gradients (ēm); see Materials and Methods for details.

