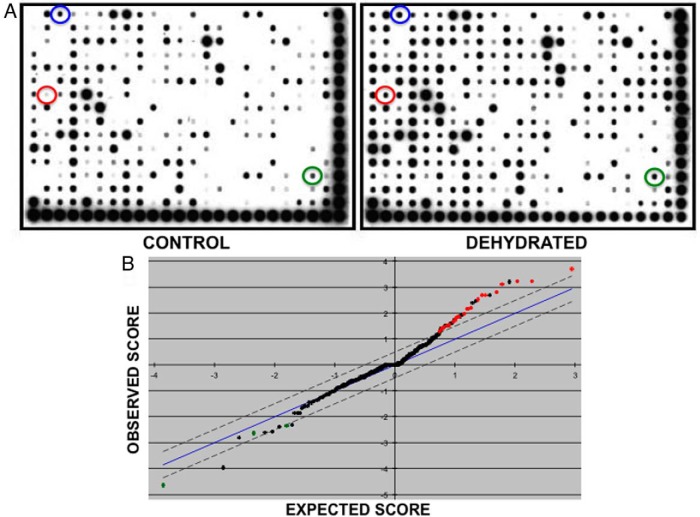
Figure 1.
Affymetrix combo protein-DNA array analysis of control and dehydrated SON DNA-binding proteins. A, Representative image of a typical experiment. The array is spotted with 345 different consensus binding sequences. The degree of probe hybridization is directly proportional to the specific binding activities present in the nuclear extracts. Films were scanned, and the intensities of individual spots were measured using ImageJ software. The spots corresponding to Stat1/Stat3 (green), Pbx1 (blue), and c-Myc-Max (red) are circled. B, SAM plot. SAM analysis of 4 independent experimental replicates revealed 23 significant increases in protein-DNA binding activity in the dehydrated groups compared with the control groups (red dots), and 3 significantly reduced protein-DNA binding activities in the dehydrated groups compared with the control groups (green dots).

