Figure 5.

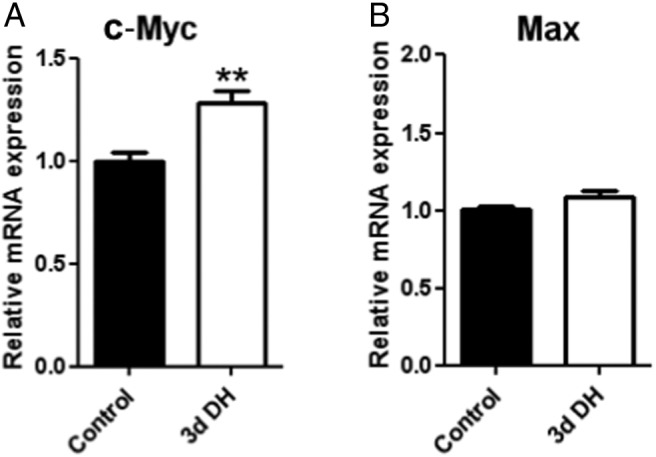
c-Myc- and Max mRNAs in the SON. Relative mRNA expression levels of (A) Myc and (B) Max in SON of 3 days of dehydrated compared with control rats (n = 6 each group). Error bar is ±SEM. **, P < .01.

c-Myc- and Max mRNAs in the SON. Relative mRNA expression levels of (A) Myc and (B) Max in SON of 3 days of dehydrated compared with control rats (n = 6 each group). Error bar is ±SEM. **, P < .01.