Figure 1.

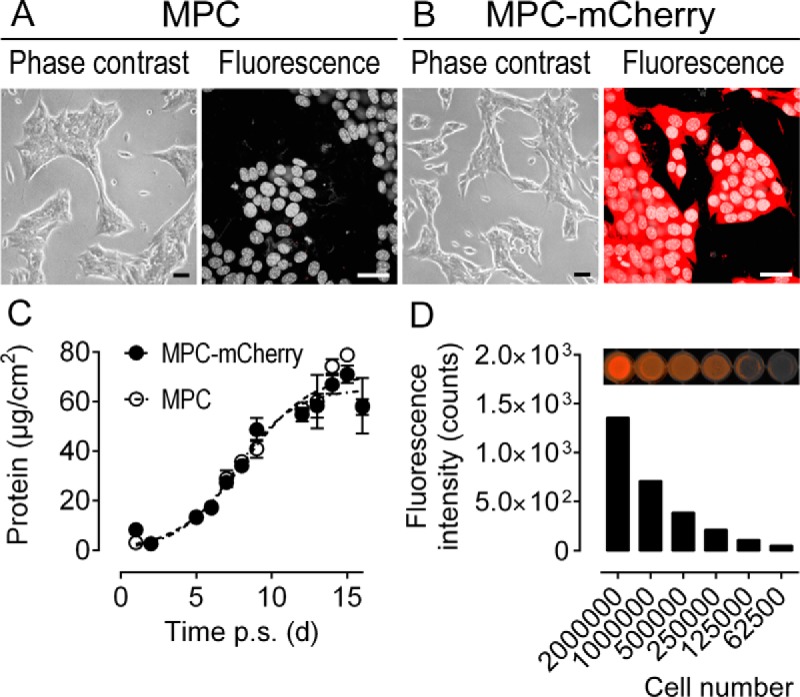
Biological properties of MPC-mCherry cells compared with nontransduced parent MPC cells in vitro; A and B, Morphological appearance and fluorescence under microscopy; nuclei stained with Hoechst 33258; scale bars, 30 μm. C, Growth of 2 × 10⁵ MPC and MPC-mCherry cells during 16 days post subculture quantified as protein of adherent cells per cm2, presented as means ± SEM, n = 4. D, Positive proportional relation of MPC-mCherry cell number and corresponding fluorescence intensities at λEx/Em = 550/600 nm.
