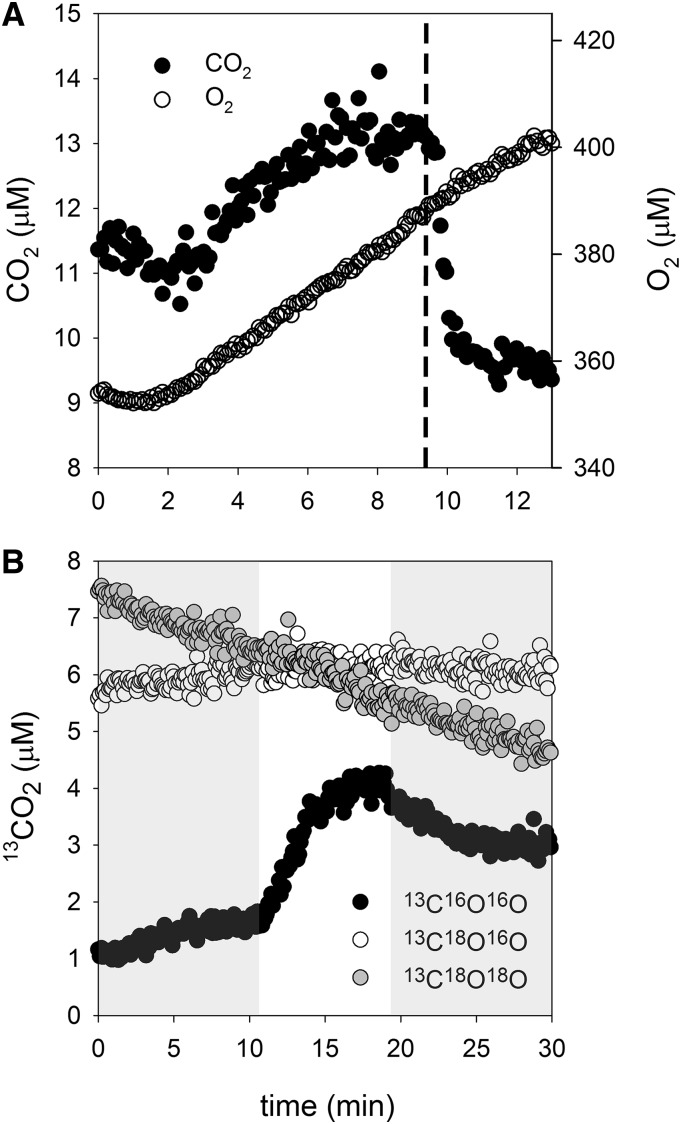
Figure 2.
A, Sample data showing increases in CO2 concentrations upon illumination in an assay chamber containing Prochlorococcus spp. MED4 and 2 mm Ci. That the CO2 concentration exceeds equilibrium with HCO3− is illustrated by the addition of bovine CA just after 9 min (dashed line), which establishes equilibrium between CO2 and HCO3−. Oxygen data show that photosynthesis was not affected by the addition of bovine CA. B, A light/dark cycle with 2 mm 13C18O-labeled Ci added to the assay chamber (darkness = gray background; illumination at 250 μmol photons m−2 s−1 = white background).

