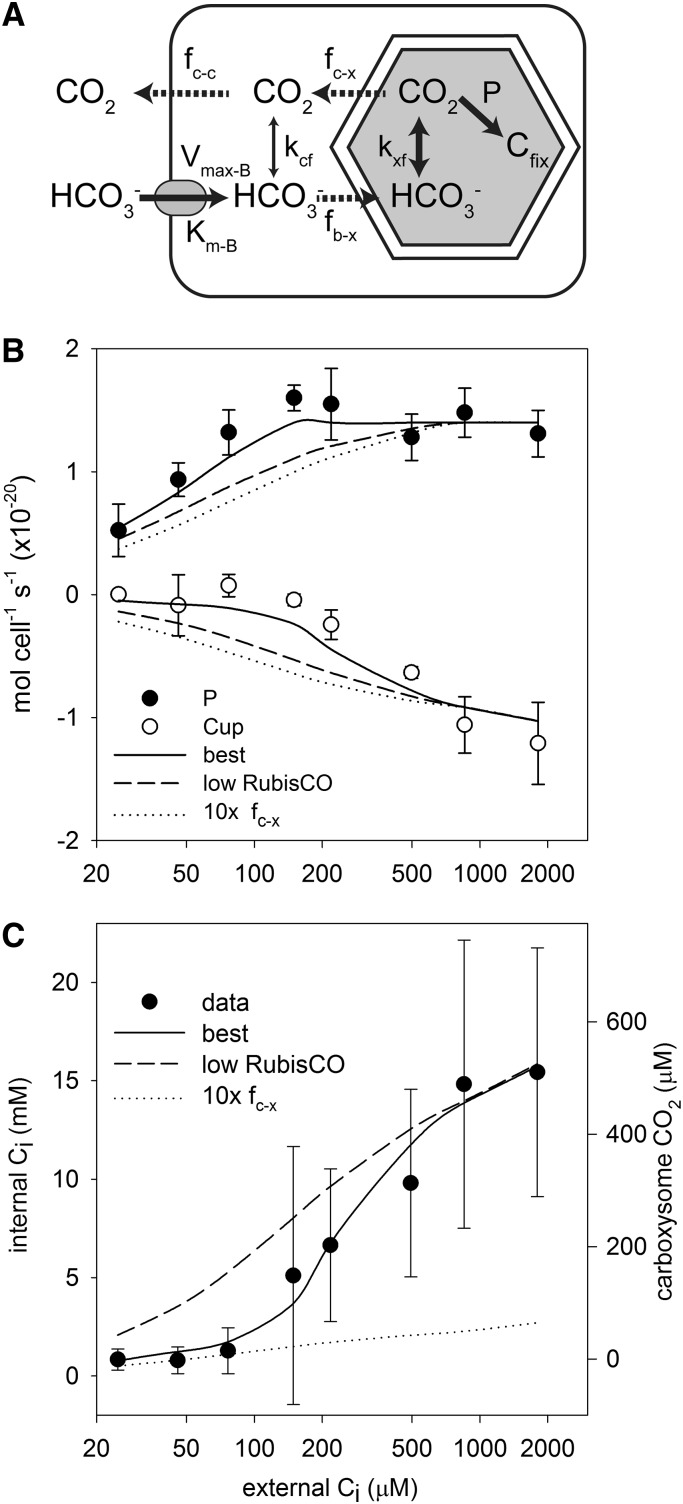
Figure 5.
Model results. The model structure diagram (A) illustrates the active fluxes (solid arrows), passive fluxes (dashed arrows), and CO2/HCO3− interconversion (double-headed arrows) in the CCM, with the parameters controlling these fluxes indicated above each arrow (for notation, see Table III). Agreement of the various models with photosynthesis (P) and CO2 flux (Cup) data (B) and the internal Ci pool (C) is shown. Inferred carboxysome CO2 concentrations were calculated as described in “Results.”

