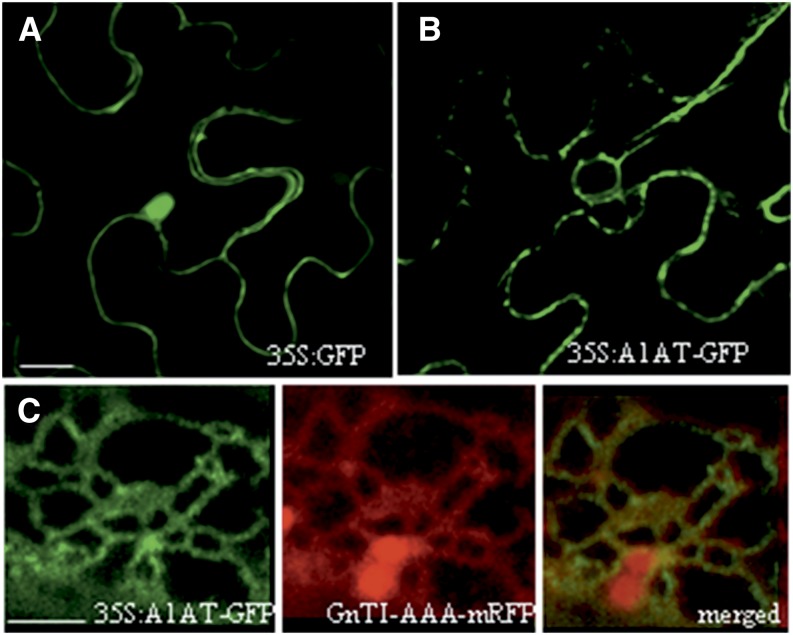
Figure 10.
Expression of A1AT-GFP shows ER localization. A, CLSM image of a representative leaf epidermal cell expressing GFP (35S:GFP). GFP is detected in the nucleus and the cytoplasm but not detected in the IF. B, CLSM image of a representative leaf epidermal cell expressing A1AT fused to GFP (35S:A1AT-GFP). The fluorescence signal displays a reticulate pattern resembling the ER. Red dots represent the Golgi apparatus. C, CLSM image from a cell coexpressing 35S:A1AT-GFP, and the ER marker GnTI-CAAATS-mRFP displays a significant colocalization of the two proteins (merged image). Red dots represent Golgi stacks. Bar = 20 μm in A and B. Bar = 2.5 μm in C.

