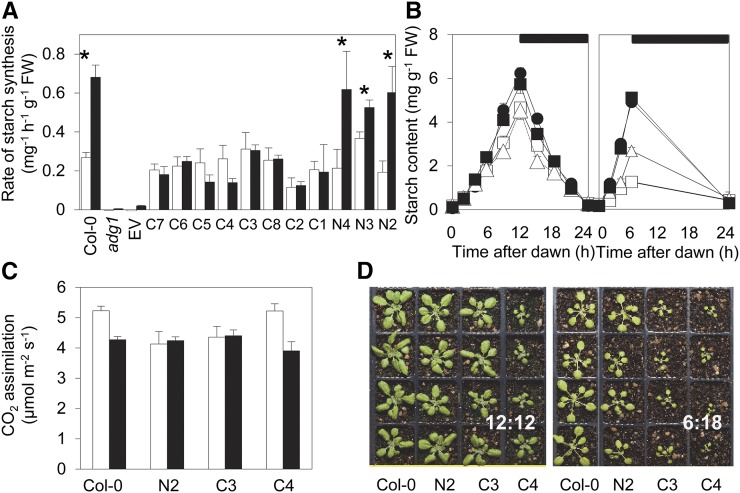
Figure 3.
Complementation of the adg1 phenotype by expression of GlgC-TM. A, Rates of starch synthesis in 12:12 (white) and 6:18 (black) conditions in wild-type (Col-0) plants, adg1 mutants, and transgenic lines of adg1 transformed with either APS1 (lines N2–N4) or GlgC-TM (lines C1–C8) on the APS1 promoter or the empty vector (EV). For each line and condition, measurements of starch contents were made on six rosettes at the beginning and end of the light period, and the rate of synthesis (± se) was calculated by linear regression. Asterisks indicate lines where rates of starch synthesis were statistically significantly different between the two daylengths (P < 0.05, multiple linear regression). B, Starch content over 24 h in plants grown in 12:12 (left, 21-d-old plants) or 6:18 (right, 28-d-old plants) conditions. Black circle indicates the wild type (Col-0), black square indicates APS1 control line N2, white triangle indicates GlgC-TM line C3, and white square indicates GlgC-TM line C4. Values are means ± se of measurements made on six plants. See Supplemental Table S1 for calculated rates of starch synthesis. C, Rates of CO2 assimilation. Measurements were made between 1 and 4 h into the photoperiod at 380 μL L−1 CO2, 210 μmol quanta m–2 s–1 light intensity, and 20°C. White bars indicate 12:12 conditions. Black bars indicate 6:18 conditions. Values are means ± se of measurements on five plants. There were no significant differences in the rate of CO2 assimilation between either transgenic line expressing GlgC-TM AGPase and the wild type or the APS1 control line (N2) in either photoperiod (Student’s t test, P > 0.05). The rate of assimilation was slightly but significantly lower in the N2 line relative to the wild type in the 12:12 photoperiod (P = 0.037) but not in 6:18. D, Plants grown in 12:12 (20 d old, left) or 6:18 (27 d old, right) conditions. Plants are the wild type (Col-0), APS1 control line N2, and GlgC-TM lines C3 and C4. FW, Fresh weight.

