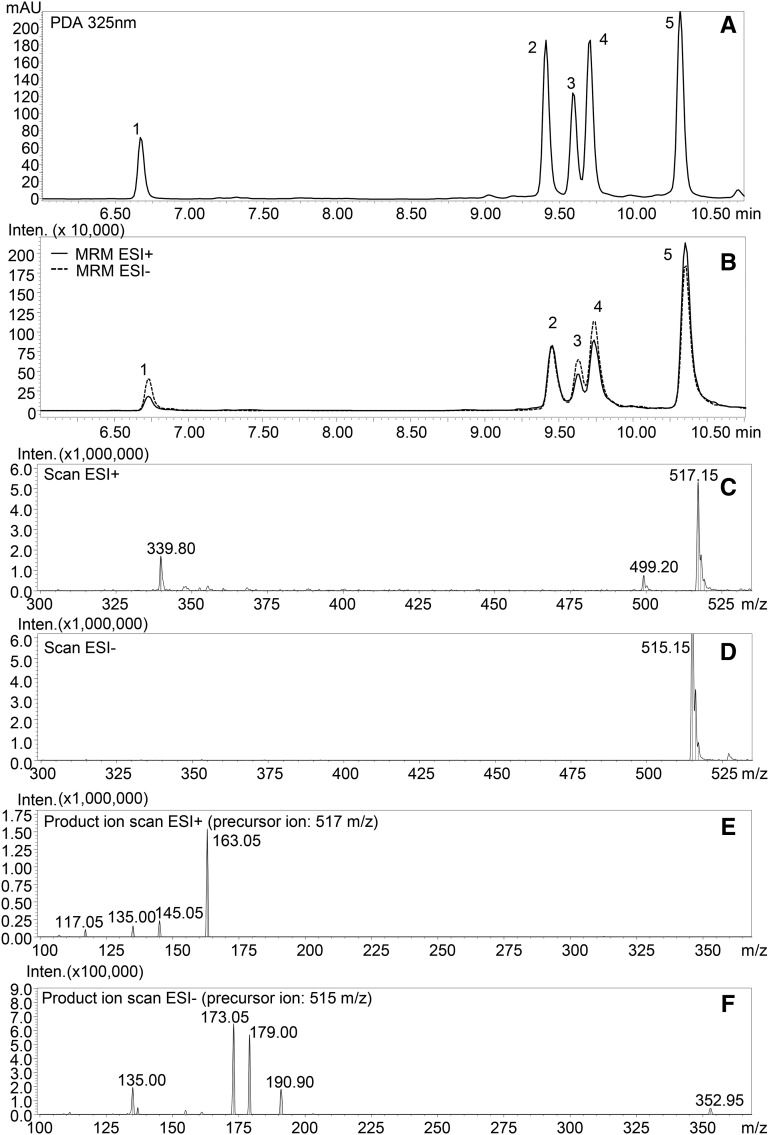
Figure 2.
LC-PDA-MS/MS profile of diCQA standard mixture. A, PDA profile at 325 nm. B, MS profile obtained in MRM acquisition mode (for transitions, see ‟Materials and Methods”). C, ESI+ full-scan spectra of 4,5-diCQA. D, ESI– full-scan spectra of 4,5-diCQA. E, ESI+ product ion scan of 4,5-diCQA (precursor ion, 517 m/z). F, ESI– product ion scan of 4,5-diCQA (precursor ion, 515 m/z). For peak numbers, 1 indicates 1,3-diCQA, 2 indicates 3,4-diCQA, 3 indicates 1,5-diCQA, 4 indicates 3,5-diCQA, and 5 indicates 4,5-diCQA. mAU, Milliabsorbance units; Inten., ion intensity.

