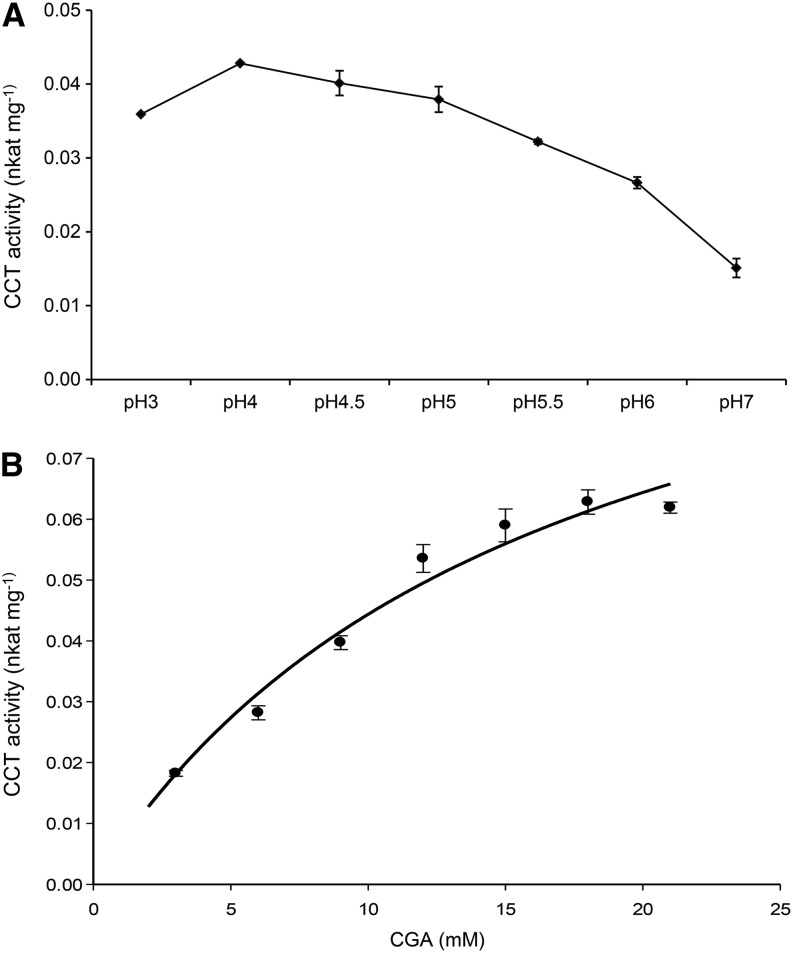
Figure 3.
CCT activity in red tomato fruit. A, CCT activity under different pH conditions (3–7). B, CCT activity in crude extract of ripe tomato with increasing concentrations of CGA. Values on the y axis are nkat mg–1 of total protein. The curve represents the best fit of the Michaelis-Menten equation to the data using SigmaPlot (Systat Software). Error bars indicate sd calculated from three biological replicates.

