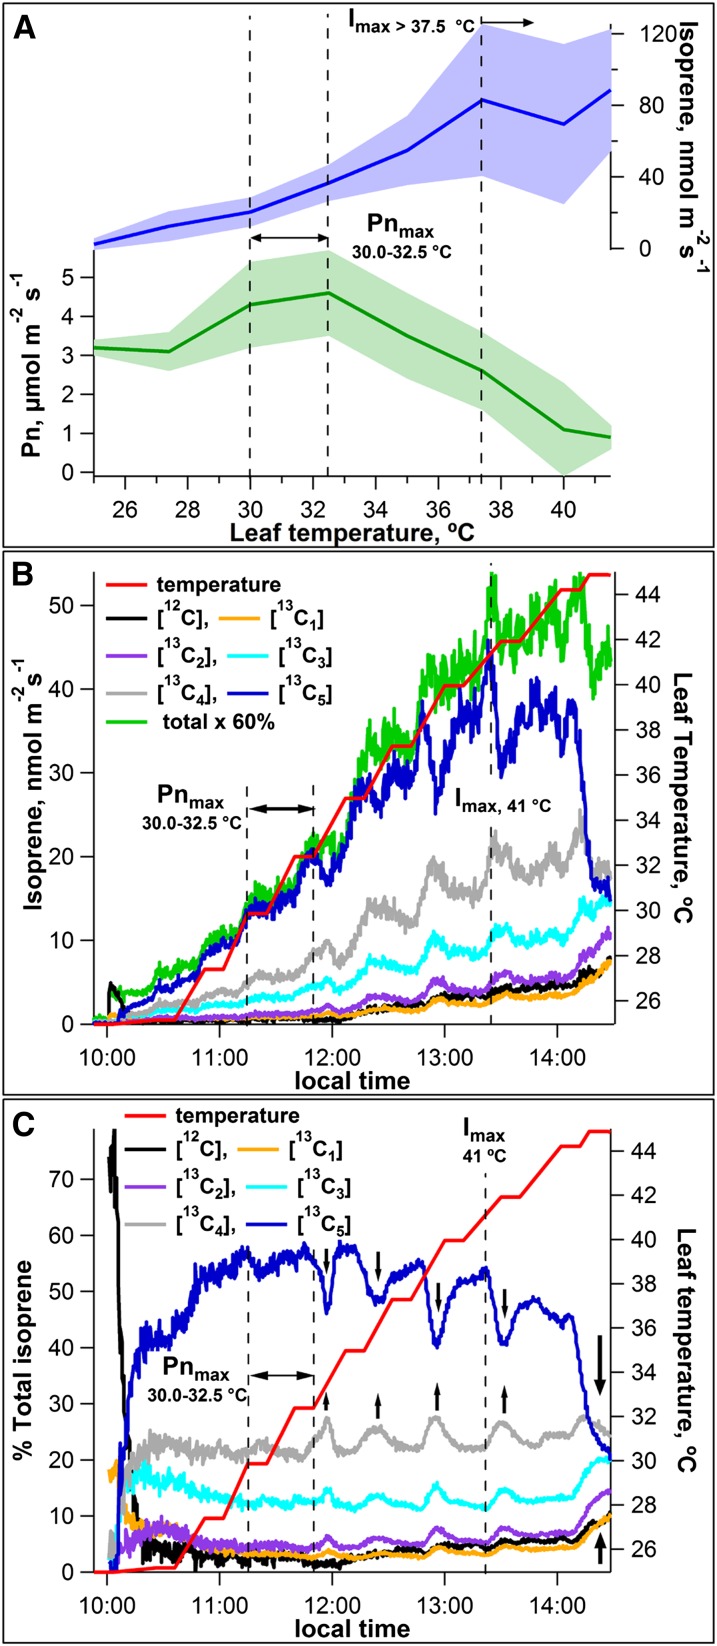
Figure 2.
Dependencies of net photosynthesis (Pn) and isoprene emission rates from mango leaves on leaf temperature under constant illumination (PAR of 1,000 µmol m–2 s–1). A, Average leaf isoprene emissions (GC-MS) and net photosynthesis rates as a function of leaf temperature from four mango leaves. Shaded areas represent ± 1 sd. Also shown are representative PTR-MS time series plots showing the influence of increasing leaf temperature on the dynamics of absolute emissions of [12C]isoprene and [13C1–5]isoprene (B) and relative isoprene isotopologue emissions rates (percentage of total; C) from a single mango leaf during photosynthesis under 13CO2. Arrows indicate periods of rapid 13C-depletion of isoprenoid intermediates followed by reenrichment. Vertical dashed lines represent optimum temperature ranges for net photosynthesis (Pnmax) and isoprene emissions (Imax).

