Figure 1.
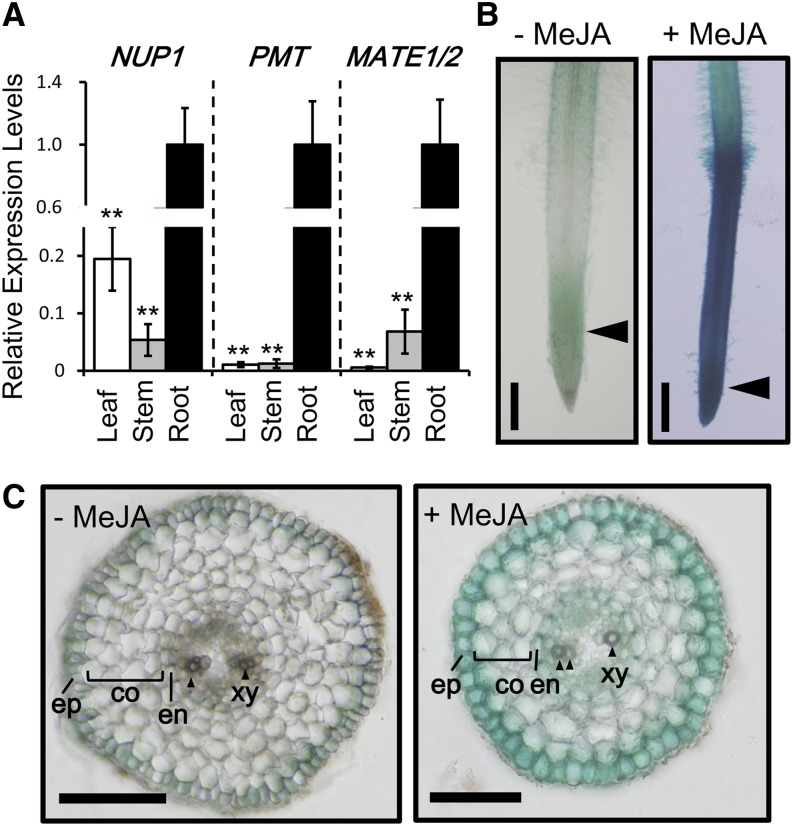
Expression patterns of NUP1. A, Quantitative RT-PCR analysis of NUP1, PMT, and MATE1/MATE2 expression in the third leaf, stem (approximately 5 cm above the soil) and root of 8-week-old tobacco ‘NC95’ plants. The data are the mean values (±sd) for three independent plants. Significant differences between root values and other sample values were determined using Dunnett’s test and are indicated by asterisks (double asterisks for P < 0.01). B and C, Histochemical GUS staining of tobacco hairy roots expressing ProNUP1::GUS grown in the absence (−) or presence (+) of 100 μm MeJA for 24 h. B, Hairy roots at the tip region. C, Cross sections of ProNUP1::GUS roots. Sections were made at the approximate positions indicated by arrowheads in B. co, Cortex; en, endodermis; ep, epidermis; xy, xylem. Arrowheads indicate xylem. Bars = 1 mm in B and 200 μm in C. [See online article for color version of this figure.]

