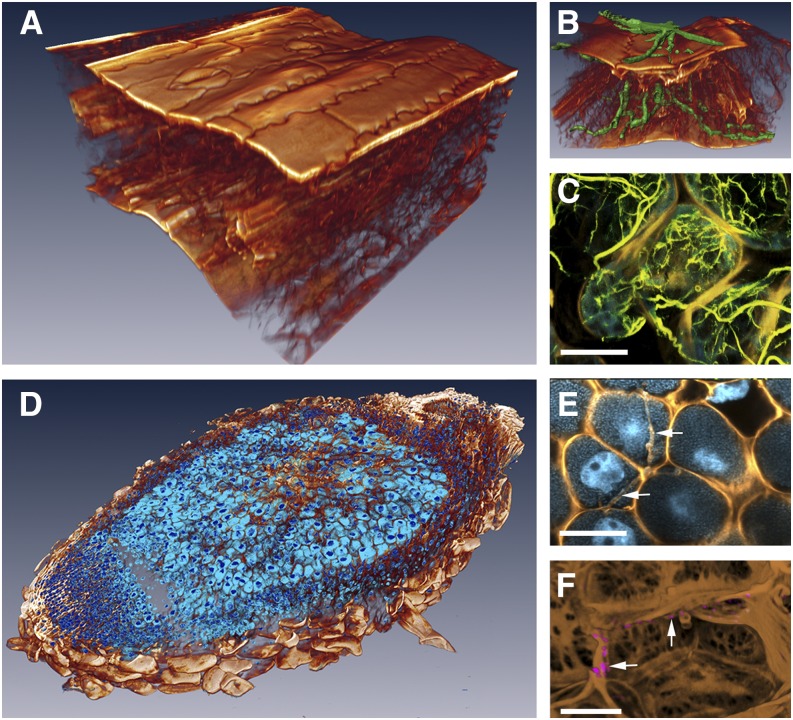
Figure 2.
Three-dimensional reconstructions of cleared specimens and compatibility with fluorescent markers. A and B, Three-dimensional rendering of a cleared maize leaf (approximately 200 µm thick). A, Cell walls were stained with Calcofluor White (brown). B, Fungal hyphae was stained with Alexa Fluor 594 wheat germ agglutinin (green). C, Three-dimensional maximum intensity projection of N. benthamiana leaf expressing protein marker mTalin-Citrine labeling actin filaments (green). D to F, Pea root nodules stained with Calcofluor White (brown) and SYTO13 (blue). D, A 200-µm-thick three-dimensional rendering reconstructed from multiple z stacks. E, An infection thread traversing multiple cells (arrows). F, Cell walls with cellulose microfibril lattice structures (brown) labeled with anti-β-1,3-glucan and Alexa Fluor 568 antibodies (arrows; magenta). Bars = 20 µm in C, E, and F.

