
Figure 3.
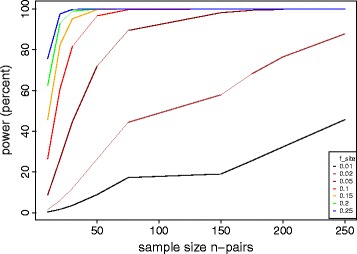
Power of the matched convergence test for identify nucleotide sites associated with a phenotype of interest. The average genetic distance between matched strains was set to an intermediate level of s = 100 mutations. Colors represent increasing values of site effect size f site.