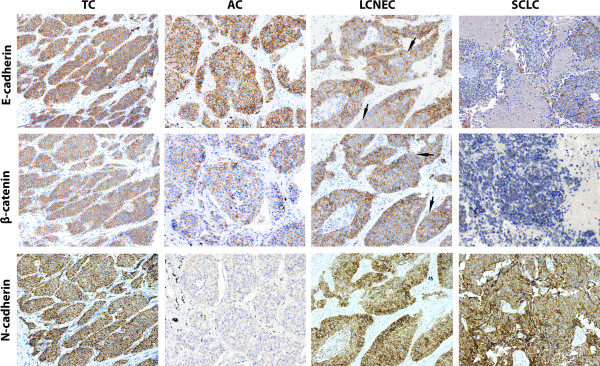
Figure 2.

Immunohistochemistry of E-cadherin, β -catenin and N-cadherin protein expression (rows) in pulmonary NETs (columns) 50 μm scale bar (200X). Consecutive tissue sections of each NET type are shown for each marker. Arrows, disrupted membranous pattern for Ecadherin/β-catenin signal.
