
Figure 5.
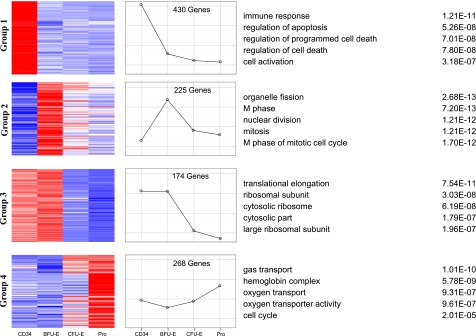
Clusters of gene expression across the different stages of early erythriod differentiation. Differentially expressed genes between adjacent stages with log fold >2 and fpkm >10 were clustered into 16 groups by the process of self-organized maps. The 4 major groups are illustrated with heat maps of the gene members of the cluster (left) and the expression profile is shown graphically (middle). GO analysis of the genes within the cluster identified the top 5 GO terms and their corresponding P-values (right).