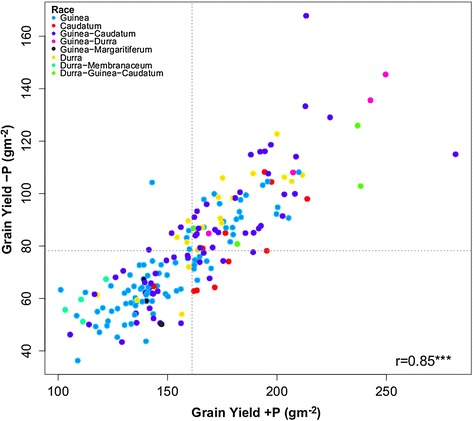
Figure 1.

Scatter plot between grain yield performance (BLUPs) of 187 sorghum genotypes estimated across sites in Mali, Niger and Senegal in 15 –P environments versus 14 + P environments, with genotype dots color-coded for their morphological race-classification.
