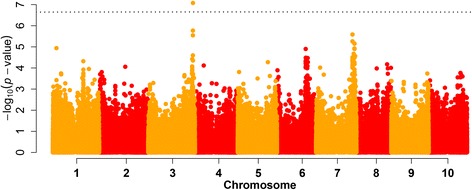
Figure 3.

Manhattan plot for sorghum grain yield BLUPs across 29 environments combined over –P and + P conditions of 187 genotypes genotyped with ~220 k SNPs with P values shown on a log 10 scale and Bonferroni threshold at p < 0.05 indicated with dashed line.
