Figure 5.

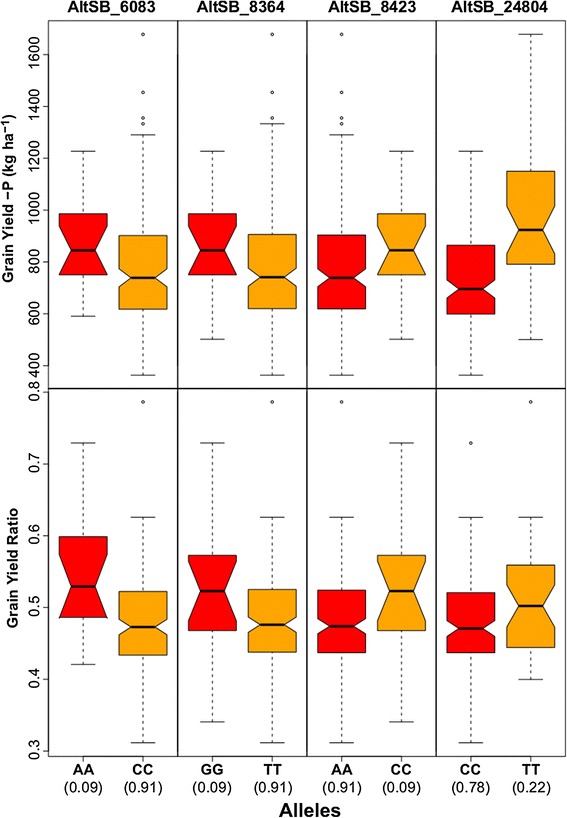
Fitted values of grain yield of the two homozygous genotypes at each of the significant SNP positions in Alt SB . Allele frequencies are given between brackets.

Fitted values of grain yield of the two homozygous genotypes at each of the significant SNP positions in Alt SB . Allele frequencies are given between brackets.