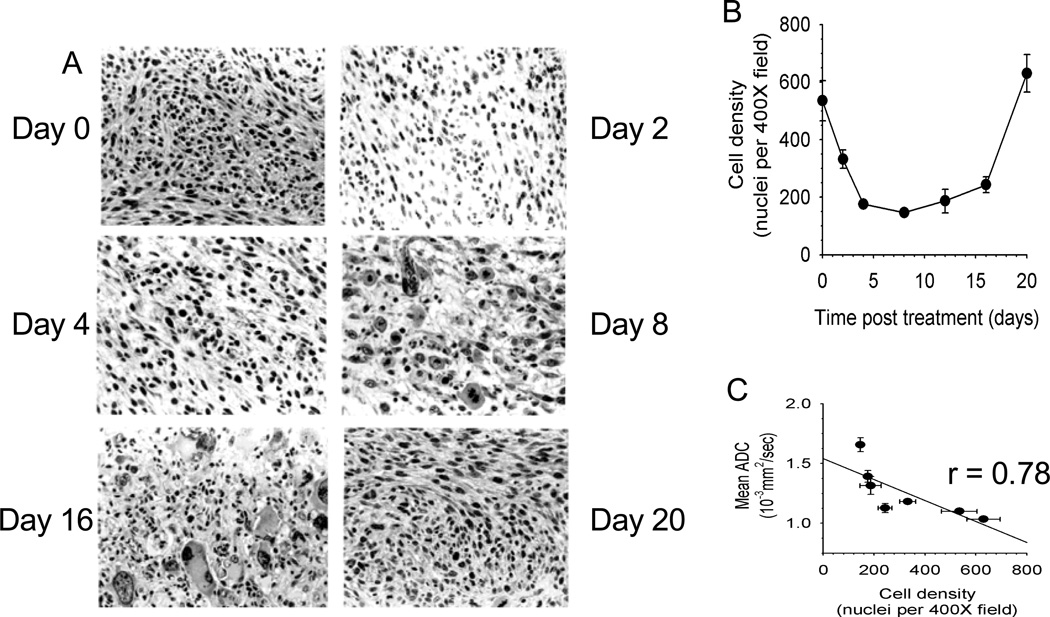
Fig. 2. Correlation of diffusion MRI changes with histopathological changes in a 9L brain tumor model treated with BCNU chemotherapy.
(a) Haematoxylin and Eosin stained histology slides showing a decrease in cell density four days following chemotherapy. As the tumor repopulates, an increase in cell dencity at day 16 is observed (b) A plot of cell density as a function of time post-therapy. (c) Correlation of ADC as a function of tumor cell density. When changes in MR diffusion (mean ADC) are plotted against cell density at each of the time points, a significant correlation is observed, demonstrating that mean ADC is a quantitative surrogate for cell density. Courtesy of Chenevert et al. [34]

