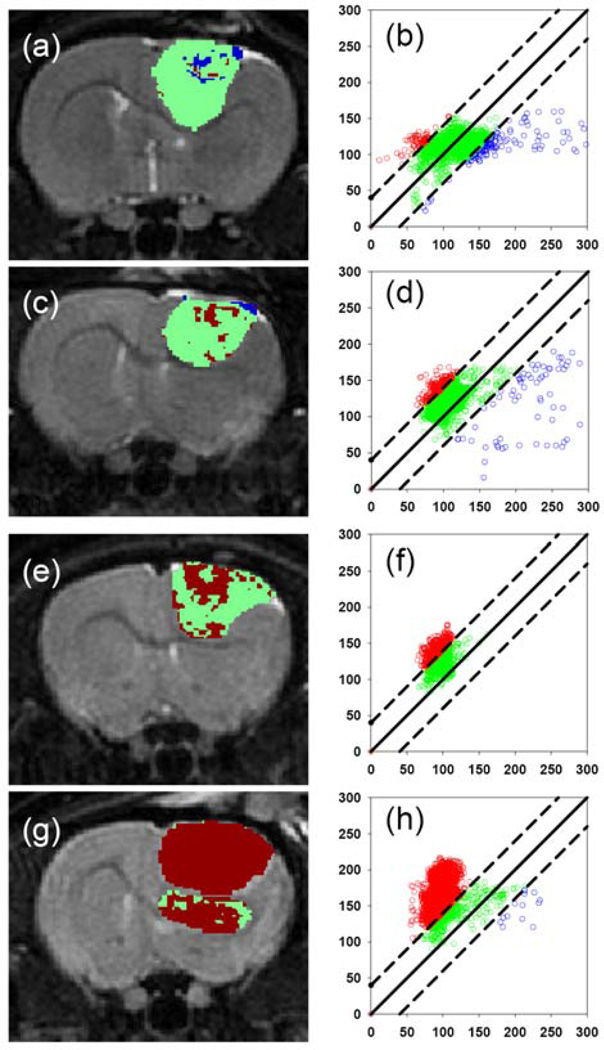
Fig. 3.
Functional diffusion mapping of a 9L brain tumor model treated with BCNU chemotherapy. The panel shows examples of FDM maps and corresponding FDM plots following a 0 (a and b), 0.5 (c and d), 1 (d and e) and 2×LD10 (f and g) doses of BCNU. These results demonstrated the quantitative nature of diffusion MRI since a dose dependent increase in tumor cell kill correlated with an increase in the number of voxels that had positive change in diffusion (red) compared to pre-treatment values. Courtesy of Moffat et al. [36].

