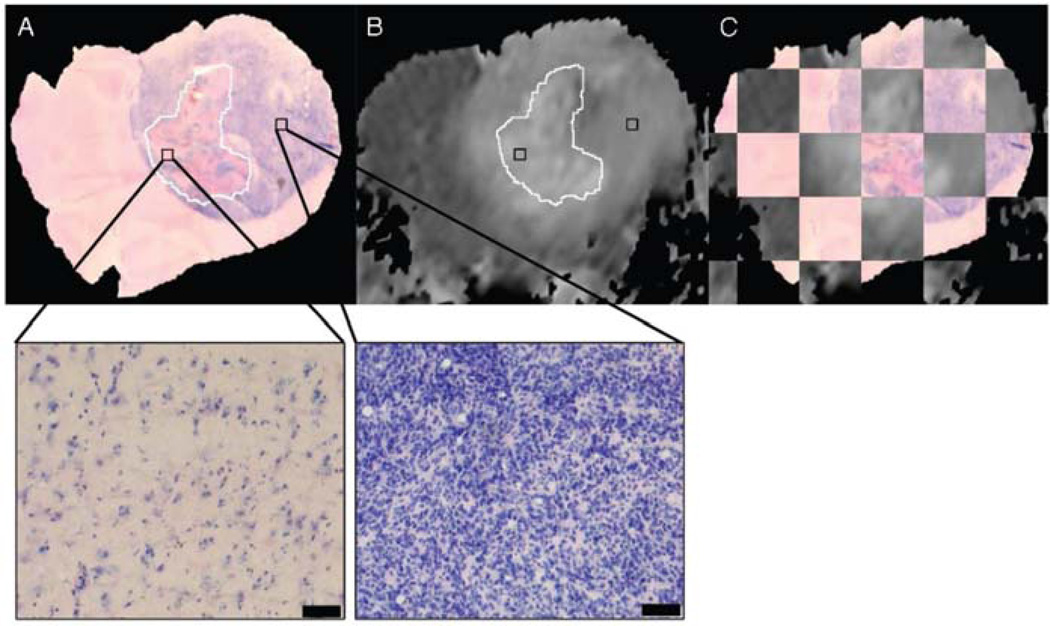
Fig. 4.
Co-registration of in-vivo diffusion MRI with histology showing that the heterogeneity of ADC within tumors correlates with the heterogeneity of cell density. (A) 10x image of a Haematoxylin and Eosin stained histology slide. (B) corresponding co-registered in-vivo ADC image. (C) Checkerboard visualisation of the accuracy of the co-registration procedure. (D) 40x image of the same histology slide showing that the hyper intense ADC regions correspond to the low cellular dense necrotic regions. Courtesy of Meyer et al. [37]

