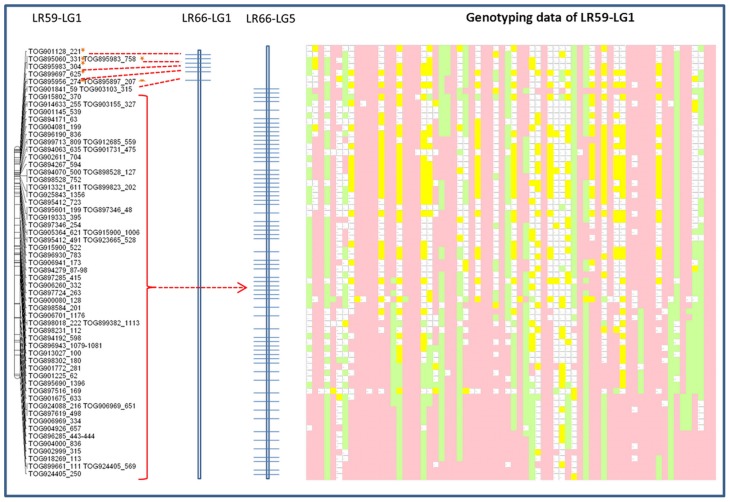
Figure 5.
Schematic representation of the distribution of Le768 OPA assay TOGs mapped in LG1 in the interspecific LR-59 population. Common markers mapped in the LR-66 population are represented on LR-66-LG1 and LR-66-LG5. Segregation of the same common markers in LR-59 is depicted by genotyping data. Each column represents an individual RIL and each row represents a locus genotyped using the TOGs. Pink blocks represent Eston (Lc) alleles, green blocks represent L01-827a (Le) alleles, yellow blocks are heterozygous loci, and blank blocks represent missing data.

