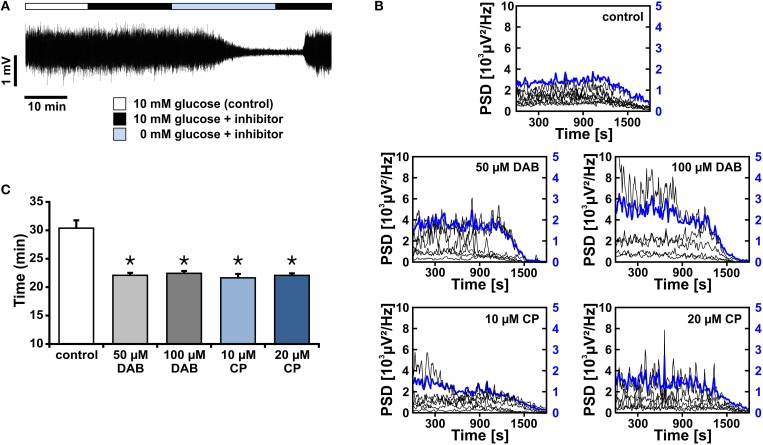
Figure 6.
Gamma oscillations and glycogen stores during glucose deprivation. (A) Gamma oscillations were induced by bath application of acetylcholine (2 μmol/L) and physostigmine (400 nmol/L) in the presence of 10 mmol/L glucose (white bar). Subsequently, inhibitors of glycogen phosphorylase, DAB (50 μmol/l or 100 μmol/L) or CP-316819 (10 μmol/L or 20 μmol/L) were applied, in the presence (black bar) or absence (light blue bar) of glucose. Note that the standard gas mixture (95% O2 and 5% CO2) was continuously present. Local field potentials (LFP) were recorded in stratum pyramidale of the CA3 subfield subfield (sample trace). (B) The peak power spectral density (μV2/Hz) for each recording trace is shown in black (scaling on left y-axis), the average of all recordings is shown in blue (scaling on right y-axis). Power spectra were calculated every 10 s and plotted over time. (C) The points in time are given for complete suppression of gamma oscillations, i.e., power reaching a threshold defined as the mean of the last 100 s plus 1 standard deviation, according to the protocol given in (A) (control, n = 10, N = 3; DAB, n = 6, N = 3, and n = 5, N = 3; CP-316819, n = 6, N = 3, and n = 5, N = 2). Note that inhibition of glycogen phosphorylase accelerates the decay of gamma oscillations during glucose deprivation. Kruskal Wallis ANOVA on ranks. Statistical significance vs. control is marked by asterisks (P < 0.05).

