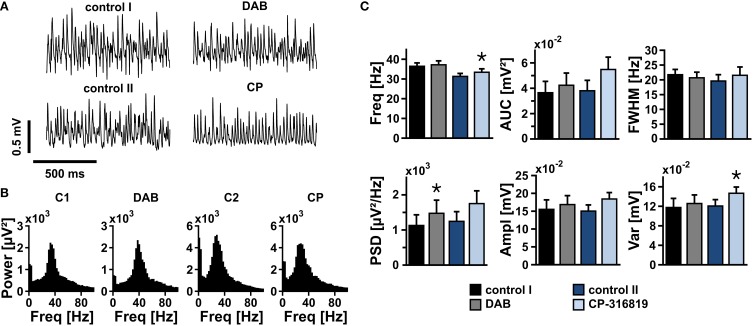
Figure 7.
Gamma oscillations and glycogen turnover. (A) Gamma oscillations were induced by bath application of acetylcholine (2 μmol/L) and physostigmine (400 nmol/L) in the presence of 10 mmol/L glucose. After 15 min, inhibitors of glycogen phosphorylase, DAB (50 μmol/l or 100 μmol/L) or CP-316819 (10 μmol/L or 20 μmol/L) were added to the recording solution. Local field potentials (LFP) were recorded in stratum pyramidale of the CA3 subfield (sample traces). (B) Corresponding power spectra of sample traces shown in (A) were calculated from 100 s taken at the end of each data segment. (C) Gamma oscillations were analyzed for various parameters, i.e., peak frequency (Freq), area under curve (AUC), full width at half maximum (FWHM), peak power spectral density (PSD), amplitude (Ampl), and variance of the amplitude (Var) (control 1 and DAB, n = 13, N = 4; control 2 and CP-316819, n = 10, N = 3). Note that inhibition of glycogen phosphorylase in the presence of 10 mmol/L glucose has only minor effects on gamma oscillations. Paired t-test or Wilcoxon signed rank test. Statistical significance is marked by asterisks (P < 0.05).

