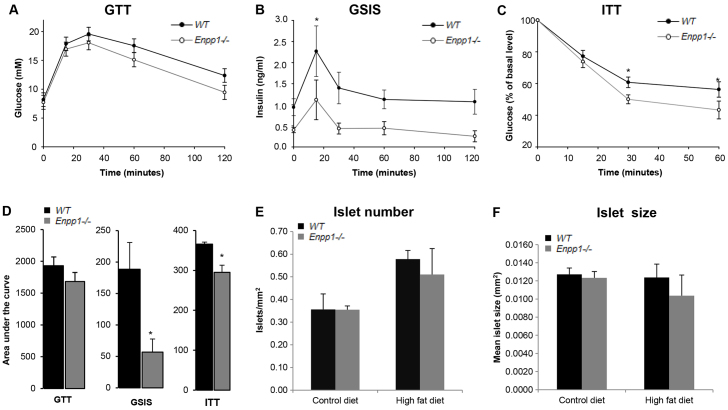
Fig. 3.
Enpp1−/− mice show improved insulin tolerance in response to a chronic HFD challenge. (A) Glucose tolerance test (GTT). (B) Glucose-stimulated insulin secretion (GSIS). (C) Insulin tolerance test (ITT) represented as percentage (%) of basal glucose. Mice were reared under high-fat dietary conditions and were 16 weeks of age. Results are presented as mean±s.e.m. (n=7). *P<0.05. (D) Metabolic tests analyzed as area under the curve. (E) Number of islets. (F) Size of islets. Results are presented as mean±s.e.m. *P<0.05.

