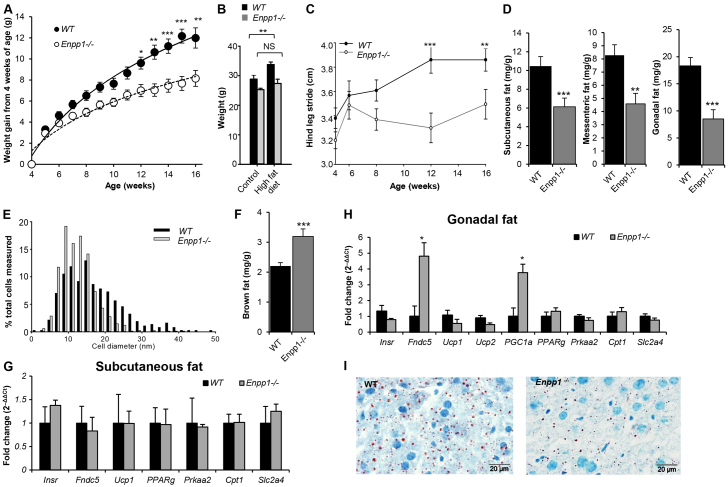
Fig. 4.
Enpp1−/− mice show pronounced obesity resistance in response to a chronic HFD challenge. Enpp1−/− and WT mice were reared on a HFD from 4 weeks of age. (A) Body weight (g) growth curves (n=16). (B) Body weight (g) at 18 weeks of age (n=8). (C) Walking gait stride length in WT and Enpp1−/− mice (n=4). (D) WAT weight analysis as a ratio to total body weight (mg/g) (n=8). (E) Maximum gonadal fat cell diameter (n=4). (F) BAT weight analysis as a ratio to total body weight (n=8). (G,H) Gene expression of WAT and BAT markers and Insr in (G) subcutaneous and (H) gonadal fat pad. (I) Histological Oil Red O staining of lipid deposits in cryosections of the liver. Mice were analyzed at 18 weeks of age after 14 weeks under high-fat dietary conditions. Results are presented as mean±s.e.m. *P<0.05, **P<0.01, ***P<0.001, NS: non-significant.

