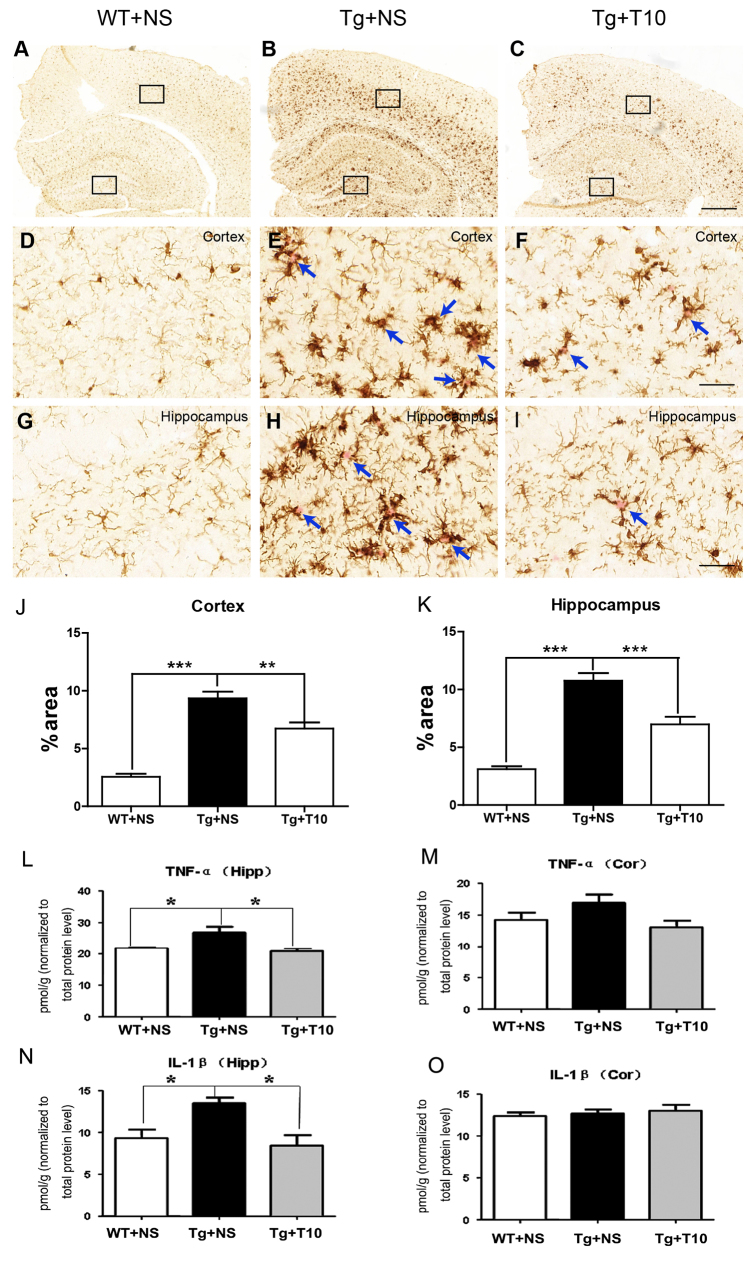
Fig. 6.
Administration of triptolide inhibited the activation of microglia and the release of proinflammatory factors. (A–C) Coronal sections of the three groups of mice indicated were stained for microglia with an antibody against Iba1 (immunohistochemical staining with DAB). (D–F) High magnification of Iba1 staining in the cortex area bracketed in A–C (upper box). (G–I) High magnification of Iba1 staining in the hippocampus bracketed in A–C (lower box). Arrows indicate Congo Red staining of senile neuritic plaques. The cortical (J) or hippocampal (K) area occupied by Iba1-positive microglia was quantified using Image Pro Plus 6.0 software. Meanwhile, frozen brain tissues were homogenized and ELISA analysis was used to measure the concentrations of TNFα (L,M) and IL-1β (N,O) in the cortex (Cor) and hippocampus (Hipp) of the three groups of mice. Concentrations were normalized to the brain wet weight in the hippocampus and cortex of all groups. The data are presented as means±s.e.m. n=6 animals per group, *P<0.05, **P<0.01, ***P<0.001 versus Tg+NS, one-way ANOVA with Tukey’s post hoc test. NS, normal saline; T10, triptolide. Scale bars: 500 μm (A–C); 50 μm (D–I).

