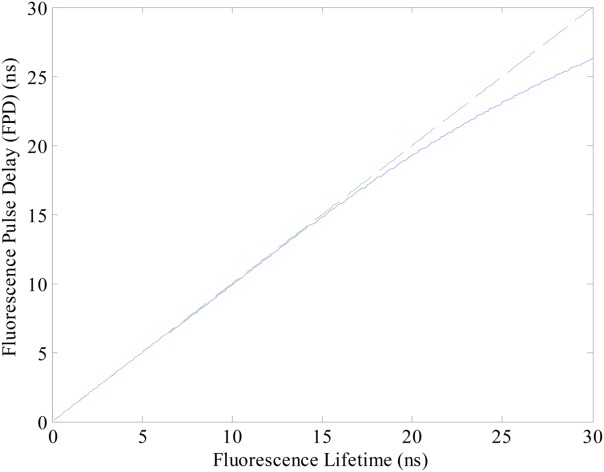
Figure 3.

Relationship between fluorescence lifetime and FPD values for a 10 µs transit time. The solid line represents the FPD values calculated for a simulated range of fluorescence lifetimes. The dashed line represents a diagonal reference line passing through the origin with the slope of 1. The solid line will coincide with the dashed line if the FPD values perfectly predict the fluorescence lifetime. [Color figure can be viewed in the online issue, which is available at wileyonlinelibrary.com.]
