
Figure 2.
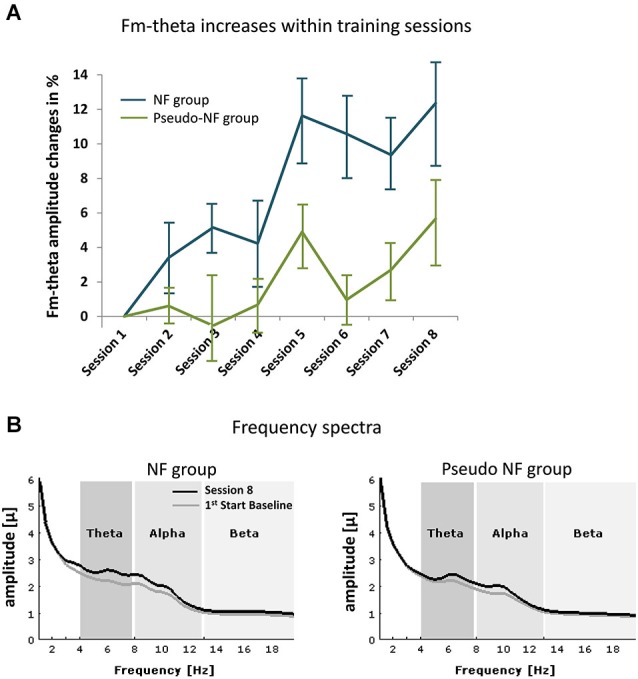
shows frequency effects during NF. (A) Depicts the means of fm-theta increases of the NF (blue lines) and the pseudo-NF group (green) within the eight training sessions (error bars represent standard error of mean). In (B) the frequency spectra are shown for the start baseline measure of the first session (in gray) and during the last training session (S8, black) for each group (left side: NF, right side: pseudo-NF group). Unspecific alpha effects are observed in both groups, whereas fm-theta is specifically increased in the experimental group.