
Figure 6.
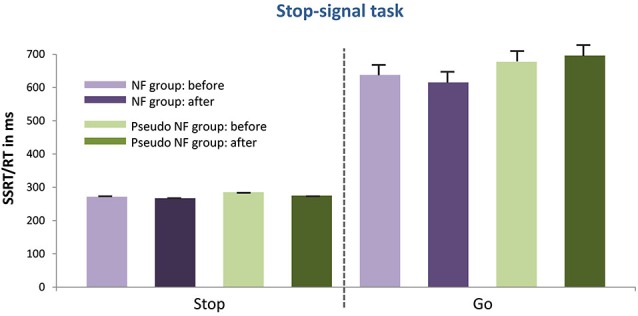
Presents the mean RTs or the SSRT (as well as the standard error of mean) of the stop signal task for the NF group (left) and the pseudo-NF group (right) for the go and stop condition before and after the training intervention. No performance differences between groups due to the intervention were shown.