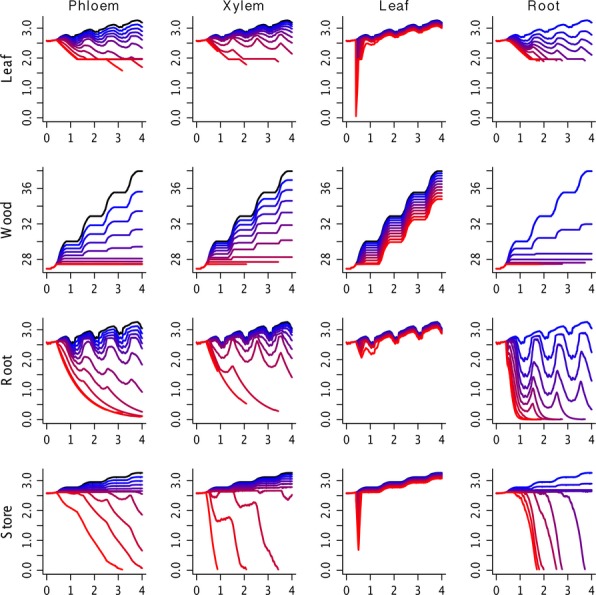
Figure 2.

Impact of biotic disturbance on biomass pools (kg/plant) arranged by PIP (columns) and pool (rows) over a 4 year period. For phloem, xylem and leaf, each line is associated with an additional 10% loss ranging arranged from the lowest (dark blue, 10%) to the largest (red, 90%), whereas for roots the same gradient represents an increase in turnover rate by 1× (dark blue) through 9× (red). Default run is in black. It is important to note that mortality does NOT reduce sizes of individual's biomass pools, but rather the stem density.
