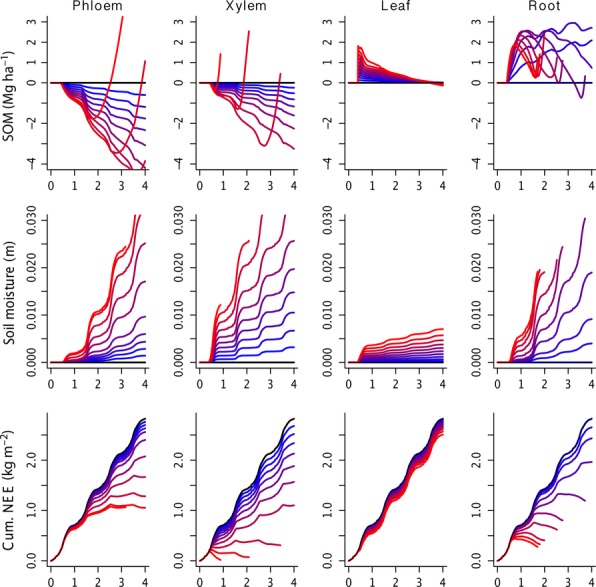
Figure 4.

Ecosystem responses to biotic disturbance over a 4 year period as a function of disturbance intensity. Impacts are arranged by PIP (columns) and intensity levels are as described in Figure 2. Soil organic matter (SOM) and soil moisture are expressed as the deviation from the default run (black line at 0) with negative indicating a loss, whereas the net ecosystem exchange of carbon (NEE) is expresses as the cumulative over the 4 year period.
